DOI:
10.1039/D4NJ01839G
(Paper)
New J. Chem., 2024,
48, 12591-12608
Synthesis, investigation of the crystal structure, DFT calculations, and in silico medicinal potential of hydrazono- and aminomethylene substituted pyrazolidine-3,5-diones as potential anticancer scaffolds†
Received
21st April 2024
, Accepted 13th June 2024
First published on 28th June 2024
Abstract
Two new pyrazolidine-3,5-dione derivatives namely (Z)-4-(2-(4-bromophenyl)hydrazono)-1-phenylpyrazolidine-3,5-dione (2) and (E)-1-phenyl-4-((pyridin-2-ylamino)methylene)pyrazolidine-3,5-dione (3) were synthesized and their structures were elucidated by single-crystal X-ray analysis along with spectroscopic techniques. Density functional theory (DFT) studies were carried out to examine the distribution of charge, and natural bond orbital (NBO) analysis and frontier molecular orbital (FMO) analysis were carried out. Hirshfeld surface analysis was carried out to examine the intermolecular interactions, revealing a prevalence of H⋯H interactions in the crystals of both molecules. NBO analysis was carried out to investigate the stabilization energy, while MEP analysis was conducted to explore regions susceptible to nucleophilic and electrophilic attacks. The molecules were screened for their medicinal potential based on physiochemical and pharmacokinetics including (gastrointestinal) GI absorption, blood brain barrier (BBB) permeation, skin permeation capability, Caco-2 permeability, Madin–Darby canine kidney (MDCK) permeability, drug metabolism by the cytochrome P450 (CYP) family of liver enzymes, and toxicity evaluations. The expected metabolic reactions in the real cell system and the resulting metabolites along with their polarities for the determination of the probability of excretion from the body and drug-likeness were studied. To investigate the anticancer potency of 2 and 3, both were docked with three enzymes as drug targets for anticancer studies including HER2 (PDB ID: 3WSQ), EGFR (PDB ID: 5WB7), and the extracellular domain of the Tdp enzyme (PDB ID: 6N0D). From the calculated binding energies and inhibition constants, 2 is a better inhibitor of the target substrates than 3.
1. Introduction
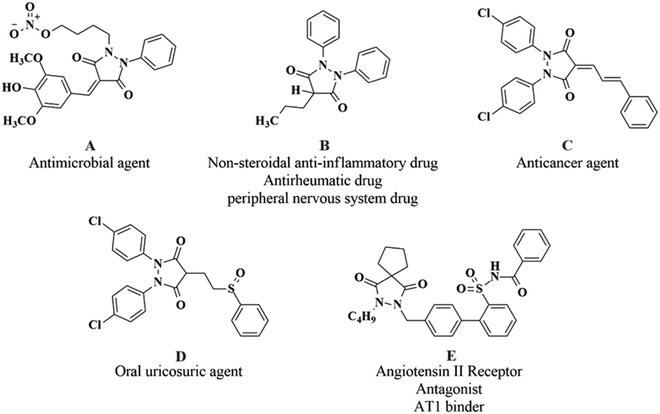
Pyrazolidine-3,5-dione derivatives exhibit remarkable biological potential with the antimicrobial properties of 4-benzylidenepyrazolidine-3,5-dione derivatives highlighting their ability to combat microbial infections.1 Also, 3,5-pyrazolidine-dione substituted 4-quinolone derivatives were explored for their efficacy as antimicrobial agents2 where their synthesis and pharmacological potential for various activities have been reported.3 These heterocyclic moieties have also been reported to be a part of compounds with potential analgesic, antipyretic, antiviral,4,5 and anti-inflammatory activities, underscoring their therapeutic versatility.6 Recently, the anticancer potential of some 4-substituted pyrazolidine-3,5-dione derivatives has been elaborated by highlighting their promising in vitro and in vivo activities against cancer cells,7 while Husseiny et al. (2023) explored the cytotoxic effect and CDK-9 inhibition potential of sulfaguanidine-based azopyrazolidine-3,5-diones and 3,5-diaminoazopyrazoles, revealing their therapeutic potential.8,9 Moreover, numerous aryl pyrazoles and pyrazole-phenyl semicarbazone derivatives have been synthesized in the quest for the exploration of anticancer leads through the studies of their bioactivities using in vitro and in silico experiments and, as a result, significant enzyme inhibitions and cytotoxic potencies have been reported which were further validated by molecular docking and simulation approaches to explore the roles of the structural fragments in binding with the target substrates,10–12 whereas Channar et al. (2018) have synthesized a series of new aryl pyrazoles being able to inhibit the mushroom tyrosinase enzyme.13 The structures of potent drugs and drug-like molecules with excellent bioactivities reported in the literature including a 4-benzylidenepyrazolidine-3,5-dione (A), phenylbutazone (B), 1,2-bis(4-chlorophenyl)-pyrazolidine-3,5-dione (C), sulfinpyrazone (D), and a spiro pyrazoline-3,5-dione (E) are shown in Fig. 1.
 |
| | Fig. 1 Structures of drugs and drug-like molecules bearing the pyrazolidine-3,5-dione moiety. | |
The new compounds were investigated for their medicinal potential based on SAR investigations and through molecular docking and simulation approaches using the enzyme substrates HER2 (PDB ID: 3WSQ), EGFR (PDB ID: 5WB7), and Tdp1 (PDB ID: 6N0D) as potential targets for anticancer drug discovery investigations.
The structures and biological capabilities of these two compounds were investigated using DFT calculations14 and Hirshfeld analysis, providing insights into their potential applications as bioactive compounds.15 In this study, we conducted experimental characterization and Hirshfeld surface analysis of the synthesized compounds, alongside evaluating interaction energies between molecular pairs.16 Additionally, we performed an in-depth theoretical analysis using DFT at the B3LYP/6-31+G(d,p) level to obtain optimized structural models and NBO charges, and to analyze molecular orbitals (MOs) and molecular electrostatic potentials (MEPs).
2. Experimental
2.1. Materials and methods
All melting points were determined on a Mel-Temp-II apparatus and were uncorrected. IR spectra were obtained on a Nicolet 710 Fourier transform (FT) instrument using potassium bromide discs. 1H NMR and 13C NMR spectra were recorded at 400 and 100 MHz, respectively, on a Bruker Biospin AG-400 spectrometer, using DMSO-d6 as a solvent and TMS as an internal reference. Mass spectra were measured on a Shimadzu Qp-2010 plus spectrometer (70 eV). Elemental analyses were carried out at the Microanalytical Center of Cairo University.
2.2. Synthesis
2.2.1. Synthesis of (Z)-4-(2-(4-bromophenyl)hydrazono)-1-phenylpyrazolidine-3,5-dione (2).
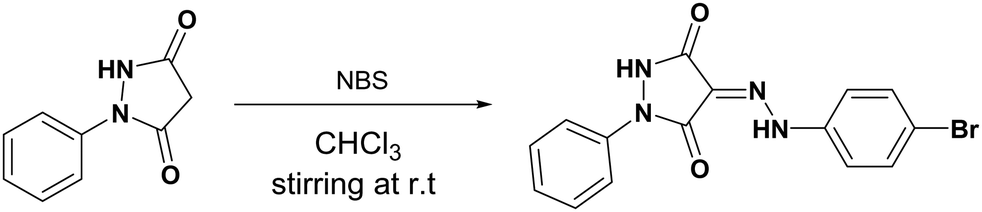
To a stirred solution of 1 mmol (176 mg) of 1-phenylpyrazolidine-3,5-dione in 10 mL of chloroform, freshly recrystallized N-bromosuccinimide 1 mmol (177 mg) was added. Stirring was continued for 24 hours at 50 °C after which chloroform was evaporated under vacuum, the residue was washed with water, and the product was collected by filtration and recrystallized from ethanol to yield red crystals (Scheme 1 and Fig. 1).
 |
| | Scheme 1 Synthesis route of 2. | |
Yield 55%; m. p. 538–539 K. IR: (KBr) ν: 3310; 3180 (2NH), 3059 (CHarom.), 1717, 1644 (2C![[double bond, length as m-dash]](https://www.rsc.org/images/entities/char_e001.gif) O) cm−1. 1H-NMR (DMSO-d6) δ: 13.19 (s, 1H, NH), 11.56 (s, 1H, NH), 7.79 (d, 1H, Harom), 7.68 (d, 1H, Harom), 7.60 (d, 2H, Harom), 7.46 (t, 4H, Harom), 7.22 (q, 2H, Harom). 13C-NMR (DMSO-d6) δ: 158.23, 156.01, 142.64, 138.19, 130.05, 129.39, 126.07, 125.13, 119.49, 118.65, 116.64. Anal. Calcd for C15H11BrN4O2 (359.18): C, 50.16; H, 3.09; Br, 22.25; N, 15.60. Found: C, 50.34; H, 2.89; Br, 22.19; N, 15.33.
O) cm−1. 1H-NMR (DMSO-d6) δ: 13.19 (s, 1H, NH), 11.56 (s, 1H, NH), 7.79 (d, 1H, Harom), 7.68 (d, 1H, Harom), 7.60 (d, 2H, Harom), 7.46 (t, 4H, Harom), 7.22 (q, 2H, Harom). 13C-NMR (DMSO-d6) δ: 158.23, 156.01, 142.64, 138.19, 130.05, 129.39, 126.07, 125.13, 119.49, 118.65, 116.64. Anal. Calcd for C15H11BrN4O2 (359.18): C, 50.16; H, 3.09; Br, 22.25; N, 15.60. Found: C, 50.34; H, 2.89; Br, 22.19; N, 15.33.
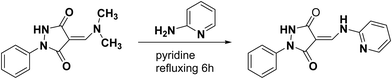
2.2.2. Synthesis of (E)-1-phenyl-4-((pyridin-2-ylamino)methylene)pyrazolidine-3,5-dione (3).
A mixture of enaminone 1 (0.23 g, 0.001 mol) and 2-aminopyridine (0.094 g, 0.001 mol) in anhydrous pyridine (15 mL) was refluxed for 4 h. After cooling, the solid product was collected by filtration and recrystallized from pyridine to obtain yellow crystals (Scheme 2 and Fig. 5).
 |
| | Scheme 2 Synthesis route of 3. | |
Yield 91%, m. p. 268–270 °C. IR (KBr) ν: 3265, 3152 (2N–H), 1690 (CO), 1650 (CO) cm−1. 1H-NMR (DMSO-d6) δ: 11.20 (s, 1H, N–H disappeared on addition of D2O), 8.83 (s, 1H, N–H disappeared on addition of D2O), 8.41 (s, 1H, N–H disappeared on addition of D2O), 7.88–7.13 (m, 10H, Harom + Holefin). Anal. Calcd for: C15H12N4O2 (280.28): C, 64.28; H, 4.32; N, 19.99. Found: C, 64.6; H, 4.41; N, 19.7.
2.3. Single-crystal X-ray analysis
Suitable crystals of 2 and 3 were affixed to polymer loops with a drop of heavy oil and placed in a cold nitrogen stream on a Bruker D8 Quest PHOTON III diffractometer. Intensity data were collected under the control of the APEX4 software17 and converted to F2 values by SAINT17 which also performed global refinements of unit cell parameters. For 2, a numerical absorption correction was applied using SADABS.18 while for 3, because the crystal was twinned, an empirical absorption correction was applied using TWINABS.19 In both cases, equivalent reflections were merged. The structures were solved by dual space methods (SHELXT19) and refined by full-matrix, least-squares procedures (SHELXL20). Hydrogen atoms attached to carbon were included as riding contributions with isotropic displacement parameters tied to those of the attached atoms. Hydrogen atoms attached to nitrogen were located in different maps and refined with DFIX 0.91 0.01 instructions. The final refinement for 2 treated it as a 2-component inversion twin while that for 3 used the full twinned data. Pertinent crystal and refinement data are given in Table S1 (ESI†).
2.4. Computational approach
A comprehensive theoretical analysis was conducted using the DFT–B3LYP/6–31+G(d,p) level implemented in GaussView21 and Gaussian 1622 to evaluate the reactivity and nonlinear optical (NLO) properties of 2 and 3. The two-dimensional fingerprint plots and three-dimensional Hirshfeld surfaces were generated by CrystalExplorer23 using the B3LYP functional and a 6–31+G(d,p) basis set to study the relative participation of intermolecular interactions within the crystal packing.
3. Results and discussion
3.1. X-ray diffraction studies
3.1.1. Crystal structure of 2.
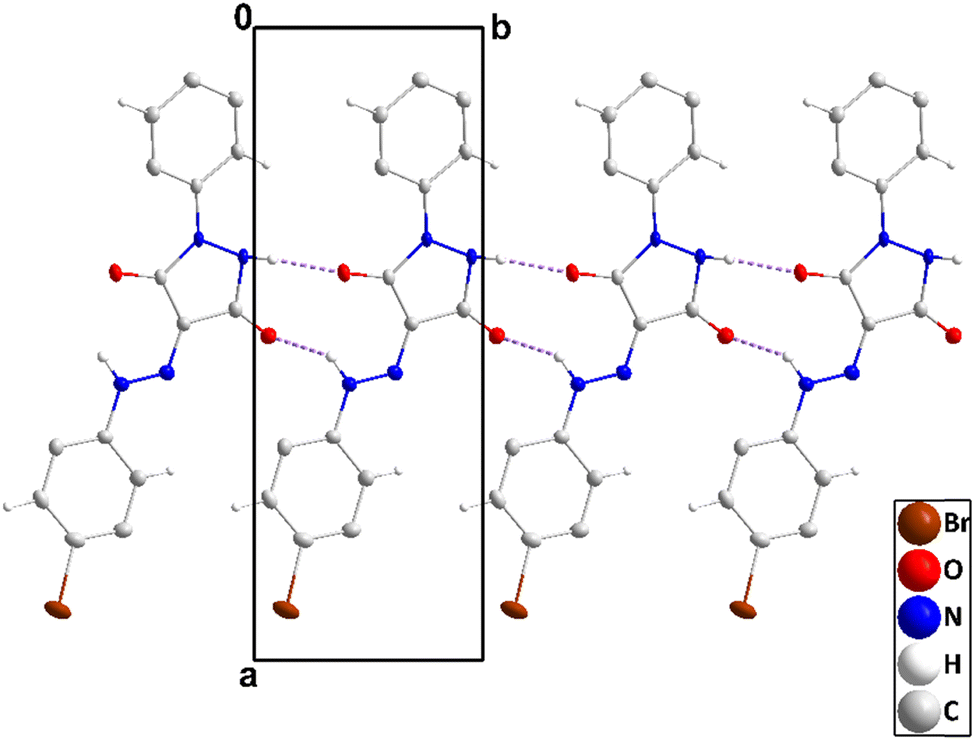
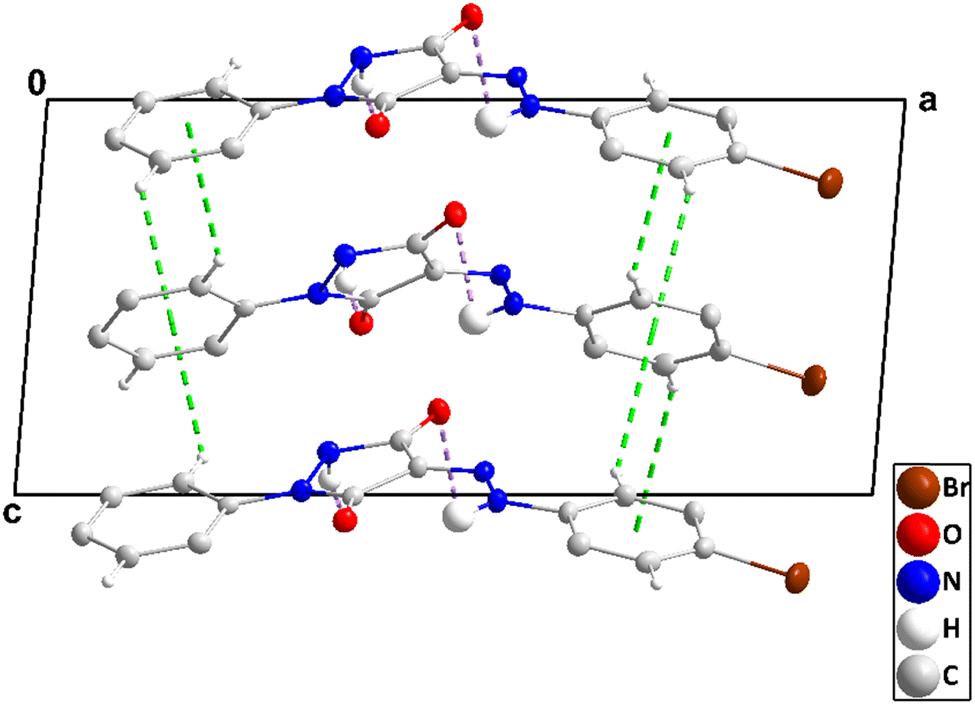
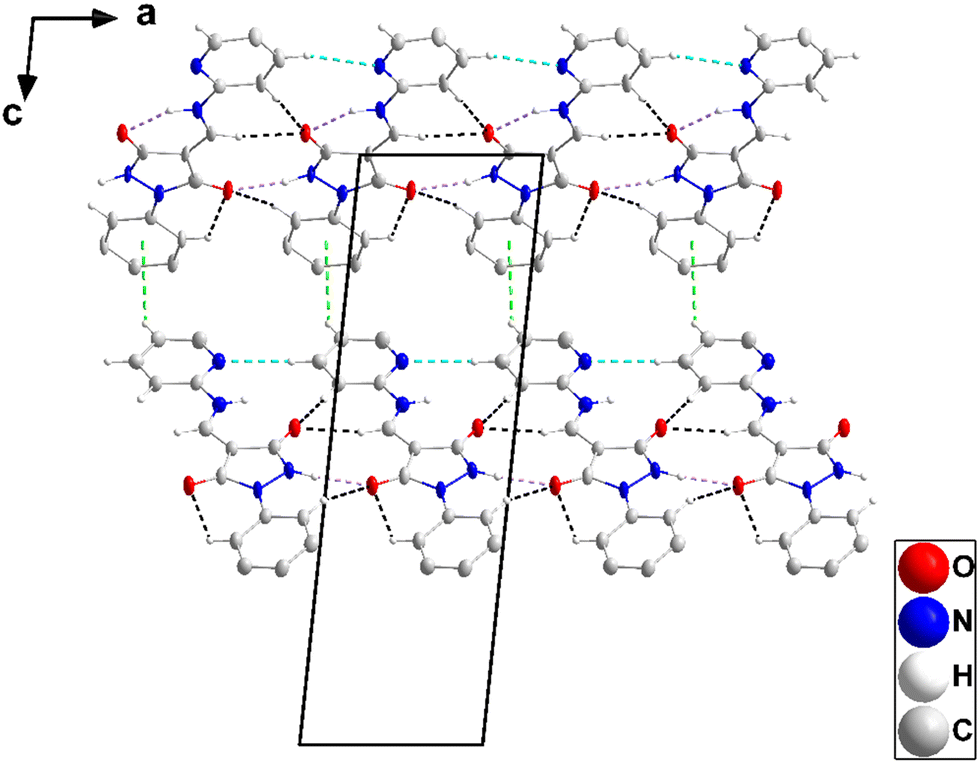
The molecule has small dihedral angles between the mean planes of the C1⋯C6 and N1/N1/C9/C8/C7 rings (6.89 (20)°) and between those of the latter ring and the C10⋯C15 ring (19.59 (16)°) and is slightly bowed from end to end (Fig. 2). The 5-membered ring is slightly “ruffled” with N1 0.0363(20) Å and N2 –0.0298(20) Å from the mean plane (r.m.s. deviation 0.0254 Å). In the crystal, zigzag chains of molecules extending along the b-axis direction are generated by N2–H2⋯O1 and weaker N4–H4A⋯O2 hydrogen bonds (Table 1 and Fig. 3). The chains are stacked along the c-axis direction by C3–H3⋯Cg2, C6–H6⋯Cg2, C12–H12⋯Cg3 and C15–H15⋯Cg3 interactions (Table 1 and Fig. 4).
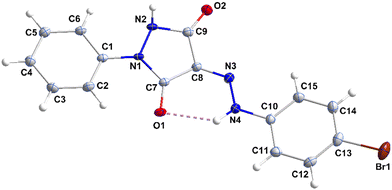 |
| | Fig. 2 Perspective view of 2 with labeling scheme and 50% probability ellipsoids. | |
Table 1 Hydrogen-bond geometries (Å, °) for 2 Cg2 and Cg3 are, respectively, the centroids of the C1⋯C6 and C10⋯C15 benzene rings
| D–H⋯A |
D–H |
H⋯A |
D⋯A |
D–H⋯A |
| Symmetry codes: (i) x, y + 1, z; (ii) x, y − 1, z; (iii) x, −y + 1, z + 1/2; (iv) x, −y + 2, z − 1/2; (v) x, −y, z + 1/2; (vi) x, −y + 1, z − 1/2. |
| N2–H2A⋯O1i |
0.897 (14) |
1.99 (2) |
2.872 (4) |
167 (6) |
| N4–H4A⋯O2ii |
0.908 (15) |
2.56 (9) |
2.866 (4) |
101 (6) |
| C2–H2⋯O1 |
0.95 |
2.30 |
2.923 (5) |
123 |
| C3–H3⋯Cg2iii |
0.95 |
2.77 |
3.452 (4) |
129 |
| C6–H6⋯Cg2iv |
0.95 |
2.88 |
3.600 (4) |
134 |
| C11–H11⋯O2iii |
0.95 |
2.49 |
3.363 (5) |
153 |
| C12–H12⋯Cg3v |
0.95 |
3.00 |
3.710 (4) |
133 |
| C15–H15⋯Cg3vi |
0.95 |
2.77 |
3.402 (4) |
125 |
 |
| | Fig. 3 A portion of one chain of 2 viewed along the c-axis direction with N–H⋯O hydrogen bonds depicted by dashed lines and non-interacting hydrogen atoms omitted for clarity. | |
 |
| | Fig. 4 End view of three chains in 2 seen along the b-axis direction with N–H⋯O hydrogen bonds and C–H⋯π(ring) interactions depicted, respectively, by violet and green dashed lines. Non-interacting hydrogen atoms are omitted for clarity. | |
3.1.2. Crystal structure of 3.
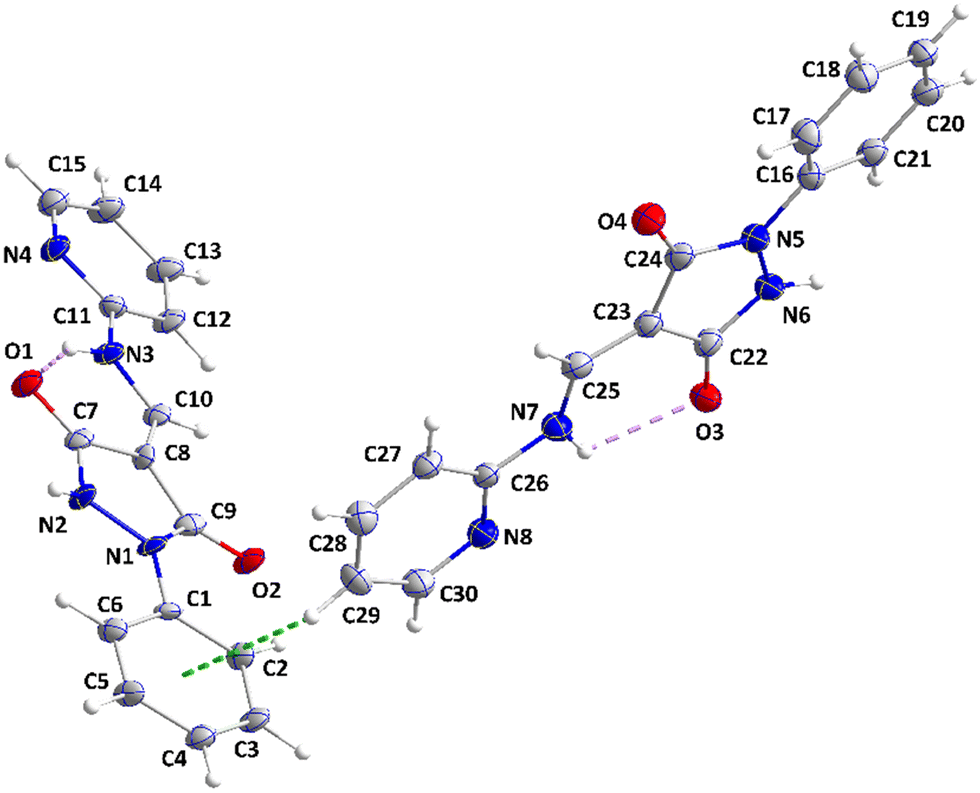
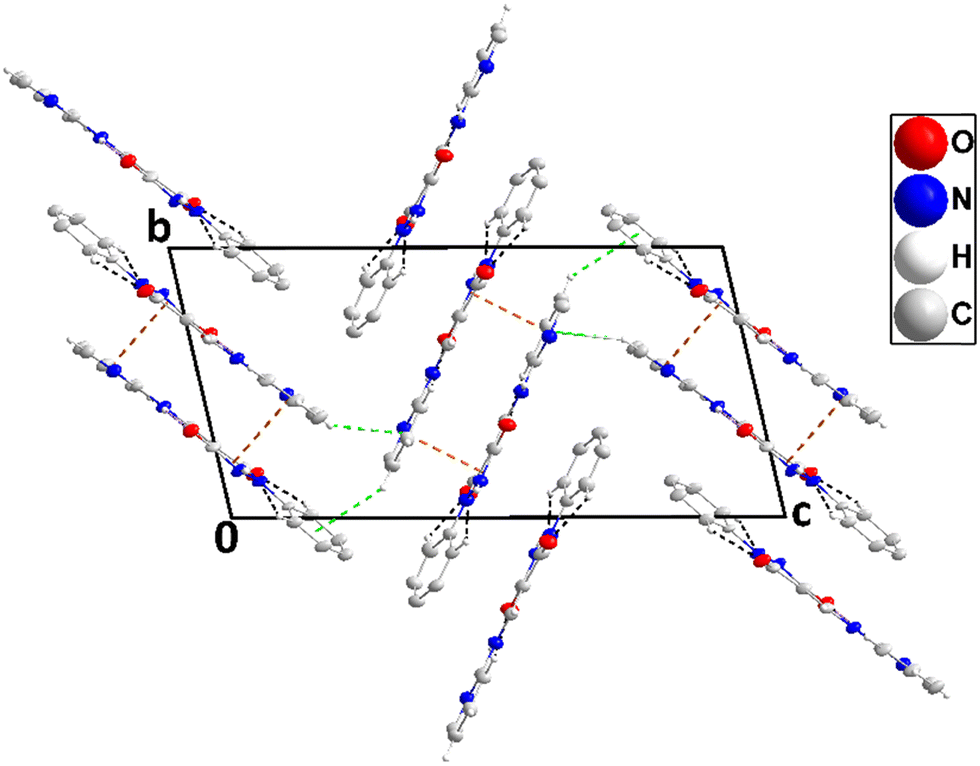
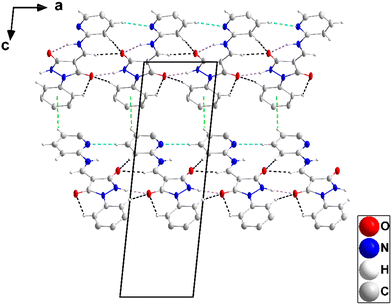
The asymmetric unit consists of two independent molecules differing modestly in the conformation. Thus, the mean planes of the C1⋯C6 and the C11⋯C15/N4 rings are inclined, respectively, to that of the N1/N2/C7/C8/C9 ring by 8.70(39) and 5.33(41)° while in the second molecule, the respective angles are 15.17(31) and 3.06(32)°. Also, the two intramolecular hydrogen bonds (N3–H3⋯O1 and N7–H7⋯O3, Table 2 and Fig. 5) are significantly different in geometry. In the crystal, the molecules containing O1 are assembled into ribbons extending along the a-axis direction by N2–H2⋯O2, C6–H6A⋯O2, C10–H10⋯O1, C12–H12⋯O1 and C13–H13⋯N4 hydrogen bonds (Table 2). Those containing O3 form comparably oriented ribbons through N6–H6⋯O4, C21–H21⋯O4, C25–H25⋯O3, C27–H27⋯O3 and C28–H28⋯N8 hydrogen bonds (Table 2). The mean planes of the ribbons make a dihedral angle of 80.6(4)° (Fig. 6). Ribbons containing O1 are connected by slipped, π-stacking interactions between N1/N2/C7/C8/C9 rings in one and inversion-related C11⋯C15/N4 rings in the next (centroid⋯centroid = 3.623(3) Å, dihedral angle = 5.3(1)°, and slippage = 1.48 Å), while ribbons containing O3 are similarly connected by slipped, π-stacking interactions between C22/C23/C24/N5/N6 rings and inversion-related C26⋯C30/N8 rings (centroid⋯centroid = 3.554(4) Å, dihedral angle = 3.1(3)°, and slippage = 1.44 Å) (Fig. 7). The two different ribbons are connected by C15–H15⋯Cg5 and C29–H29⋯Cg3 interactions (Table 2 and Fig. 8).
Table 2 Hydrogen-bond geometries (Å, °) for 3 Cg3 and Cg5 are the centroids, respectively, of the C1⋯C6 and the C26⋯C30/N8 rings
| D–H⋯A |
D–H |
H⋯A |
D⋯A |
D–H⋯A |
| Symmetry codes: (i) x − 1, y, z; (ii) x + 1, y, z; (iii) −x, −y + 1, −z. |
| N2–H2⋯O2i |
0.911 (11) |
1.950 (15) |
2.856 (6) |
172 (6) |
| N3–H3⋯O1 |
0.913 (11) |
1.97 (4) |
2.781 (6) |
148 (6) |
| C2–H2A⋯O2 |
0.95 |
2.26 |
2.885 (7) |
123 |
| C6–H6A⋯O2i |
0.95 |
2.50 |
3.377 (7) |
153 |
| C10–H10⋯O1ii |
0.95 |
2.27 |
3.216 (7) |
171 |
| C12–H12⋯O1ii |
0.95 |
2.26 |
3.204 (7) |
173 |
| C13–H13⋯N4ii |
0.95 |
2.55 |
3.451 (8) |
159 |
| C15–H15⋯Cg5iii |
0.95 |
2.95 |
3.782 (7) |
147 |
| N6–H6⋯O4ii |
0.909 (11) |
1.97 (2) |
2.843 (6) |
162 (6) |
| N7–H7⋯O3 |
0.913 (11) |
2.24 (6) |
2.791 (6) |
118 (5) |
| C17–H17⋯O4 |
0.95 |
2.32 |
2.915 (8) |
121 |
| C21–H21⋯O4ii |
0.95 |
2.55 |
3.384 (7) |
147 |
| C25–H25⋯O3i |
0.95 |
2.27 |
3.207 (7) |
170 |
| C27–H27⋯O3i |
0.95 |
2.23 |
3.164 (7) |
170 |
| C28–H28⋯N8i |
0.95 |
2.56 |
3.468 (9) |
160 |
| C29–H29⋯Cg3 |
0.95 |
2.92 |
3.697 (7) |
140 |
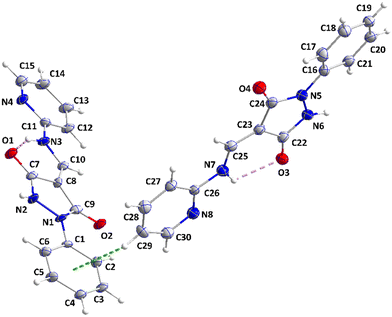 |
| | Fig. 5 The asymmetric unit of 3 with a labeling scheme and 50% probability ellipsoids. The intramolecular N–H⋯O hydrogen bonds are depicted by violet dashed lines and the C–H⋯π(ring) interaction by a green dashed line. | |
 |
| | Fig. 6 Portions of two chains in 3 viewed along the b-axis direction with N–H⋯O, C–H⋯O, and C–H⋯N hydrogen bonds depicted, respectively, by violet, light blue, and black dashed lines. The C–H⋯π(ring) interactions are depicted by green dashed lines and non-interacting hydrogen atoms are omitted for clarity. | |
 |
| | Fig. 7 Packing in 3 viewed along the a-axis direction with C–H⋯O hydrogen bonds depicted by black dashed lines and C–H⋯π(ring) and slipped π-stacking interactions, respectively, by green and orange dashed lines. Non-interacting hydrogen atoms are omitted for clarity. | |
 |
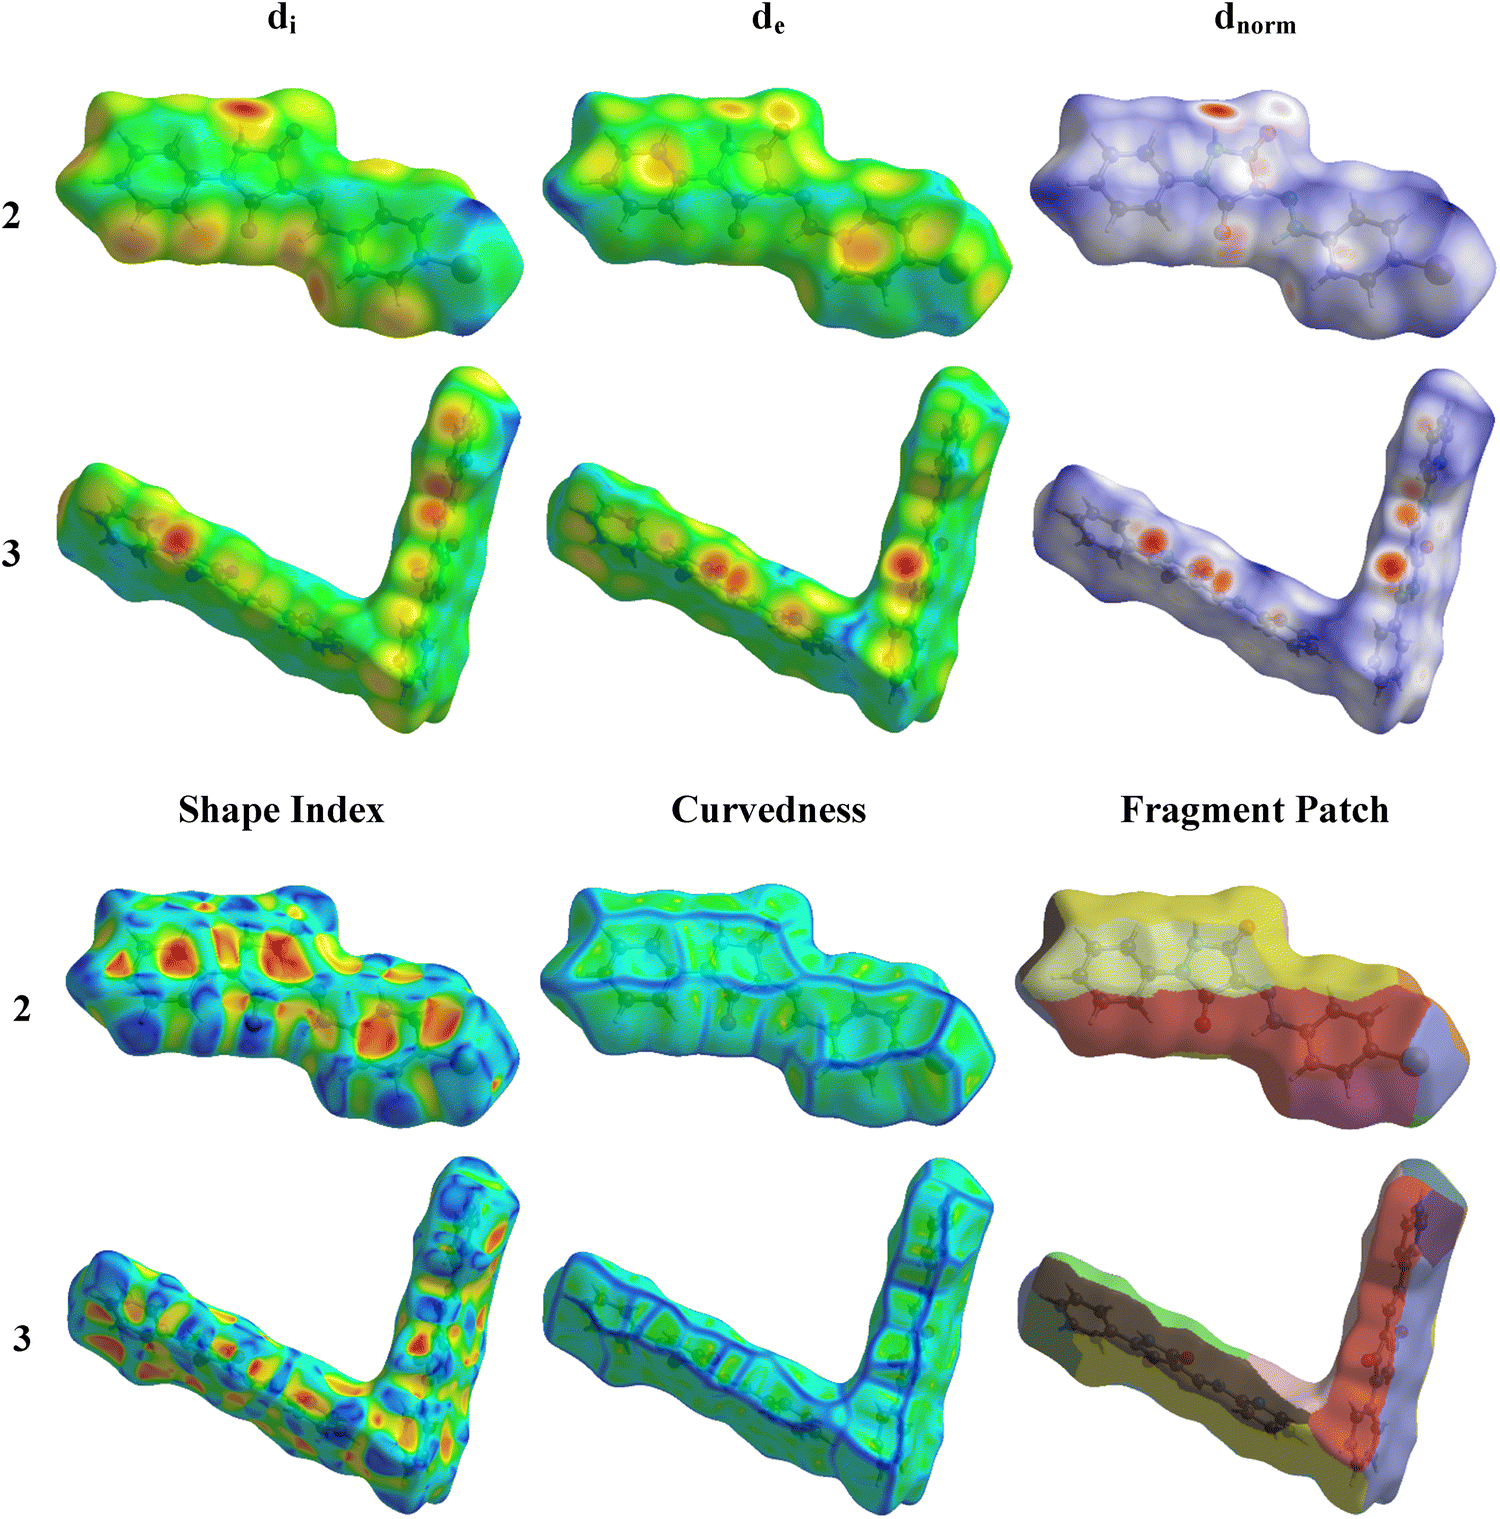
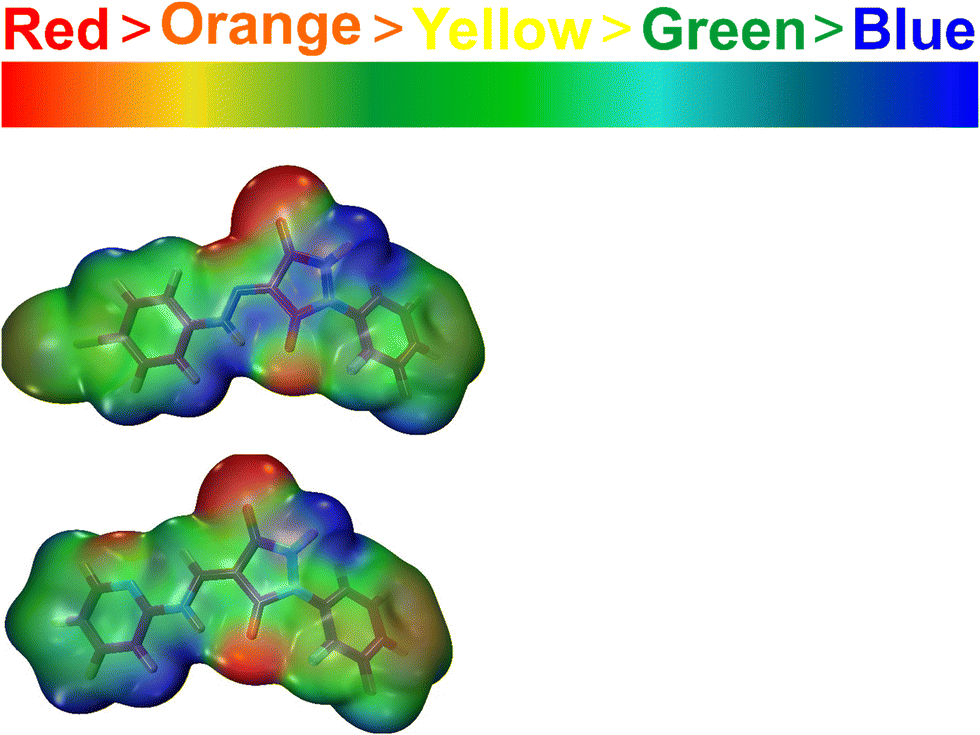
| | Fig. 8 Three-dimensional representations of Hirshfeld surfaces of 2 and 3. | |
3.2. Hirshfeld surface analysis
The interactions within a molecular crystal are illustrated by the three-dimensional dnorm, de, di, fragment patch, and shape index Hirshfeld surfaces which, for 2 and 3, are shown in Fig. 8. Details of the construction and interpretation of these surfaces have been published.24
Compounds 2 and 3 exhibit several red spots on their dnorm surfaces showing the intermolecular hydrogen bonds and substantial green areas outlined in blue on the curved surface indicate the π–π interactions (Fig. 8).25,26 In the dnorm map for both compounds, the prominent red spots correspond to the formation of N2–H2⋯O1 and N4–H4⋯O2 hydrogen bonds in compound 2. These bonds involve the oxygen atom from the carbonyl group of the pyrazole ring as the acceptor. A similar pattern of intense red regions, indicating N–H⋯O hydrogen bonds, has been observed in compound 3, and these interactions are depicted as N2–H2⋯O2 and N3–H3⋯O1, where crystal packing is primarily influenced by such hydrogen bonds. These contacts (Fig. 8) represent the strongest hydrogen bonding interactions in the crystal packing, as reflected in the geometric parameters listed in Tables 1 and 2.27,28 The configuration of convex blue and concave red triangles, in the shape index diagram for both compounds (Fig. 8), indicates the existence of π-stacking interactions involving the halophenyl ring in compound 2. These π⋯π stacking interactions, which are in agreement with the structural findings, include the bromophenyl ring and the pyrazole ring. On the curved surfaces of both compounds, these interactions are also visible as comparatively large green flat patches.29
A concise overview of interactions within the crystal packing is offered by two-dimensional fingerprint plots which also provide the percentage contribution of various contacts to the total area of the Hirshfeld surface (Fig. S1, ESI†). The H⋯H interactions are the major contributors for both 2 and 3 amounting to 22.1% and 38.2% of the total area of the Hirshfeld surface, respectively. For 2, C⋯H/H⋯C (14.4%), Br⋯H/H⋯Br (9.9%), and O⋯H/H⋯O (6.3%) contribute less, while for 3 C⋯H/H⋯C, O⋯H/H⋯O, and C⋯C contribute approximately 9.0%, 8.7%, and 6.3%, respectively.30
3.3. Three-dimensional energy framework study
To understand the Coulomb, dispersion, and total interaction energies involved in supramolecular assembly within a molecular crystal, energy frameworks for 2 and 3 were computed using the B3LYP functional with the 6–31+G(d,p) basis set for a distance of 3.8 Å around one molecule. The calculated interaction energies and symmetry operations for 2 and 3 having seven and twelve molecules are given in Table 3. In 2, the molecule at a distance of 16.11 Å has the lowest total energy (−4.0) while the molecule at a distance of 3.72 Å has the highest total energy value (−63.8 kJ mol−1). In 3, the molecule at a distance of 10.98 Å has the lowest total energy value (−4.4).31
Table 3 Intermolecular interaction energies (kJ mol−1) for 2 and 3
|
N
|
Symmetry operation |
R
|
Electron density |
E
ele
|
E
pol
|
E
dis
|
E
rep
|
E
tot
|
| Compound 2 |
| 0 |
x, y, z |
16.11 |
B3LYP/6–31G(d,p) |
0.2 |
−0.1 |
−4.7 |
0.0 |
−4.0 |
| 0 |
x, −y, z + ½ |
16.23 |
−0.4 |
−0.2 |
−7.7 |
0.0 |
−7.3 |
| 0 |
x, y, z |
17.12 |
−2.8 |
−0.2 |
−8.2 |
0.0 |
−10.2 |
| 2 |
x, −y, z + ½ |
3.72 |
−32.9 |
−6.2 |
−76.9 |
68.9 |
−63.8 |
| 0 |
x, y, z |
5.80 |
−39.3 |
−9.5 |
−42.8 |
58.6 |
−49.7 |
| 0 |
x, –y, z + ½ |
6.85 |
−0.7 |
−0.8 |
−19.6 |
10.3 |
−12.1 |
| 0 |
x, −y, z + ½ |
6.93 |
−11.8 |
−5.1 |
−36.6 |
22.5 |
−34.2 |
| Compound 3 |
| 0 |
— |
10.51 |
B3LYP/6–31G(d,p) |
−5.9 |
−1.2 |
−16.6 |
16.7 |
−11.3 |
| 1 |
−x, −y, −z |
5.17 |
−14.1 |
−4.2 |
−86.0 |
55.4 |
−58.7 |
| 1 |
−x, −y, −z |
8.02 |
−2.9 |
−3.0 |
−21.4 |
11.7 |
−16.6 |
| 1 |
x, y, z |
6.20 |
−86.2 |
−20.2 |
−36.3 |
99.3 |
−76.3 |
| 0 |
— |
10.89 |
−0.3 |
−0.2 |
−8.7 |
4.3 |
−5.4 |
| 0 |
— |
10.40 |
−2.9 |
−0.5 |
−13.7 |
9.2 |
−9.7 |
| 1 |
−x, −y, −z |
5.11 |
−16.5 |
−3.9 |
−79.0 |
44.9 |
−61.4 |
| 1 |
— |
10.51 |
−0.7 |
−0.8 |
−14.3 |
13.8 |
−5.2 |
| 1 |
— |
10.46 |
−2.9 |
−0.7 |
−10.6 |
8.9 |
−7.3 |
| 0 |
−x, −y, −z |
7.32 |
0.0 |
−3.6 |
−28.2 |
13.0 |
−19.2 |
| 0 |
— |
10.95 |
1.5 |
−0.8 |
−7.1 |
3.2 |
−6.4 |
| 0 |
— |
10.98 |
0.4 |
−0.3 |
−7.0 |
2.4 |
−4.4 |
The components of the interaction energies (repulsion, electrostatic, dispersion, and polarization) for 2 are 160.3, −54.8, −196.5, and −22.1 kJ mol−1, respectively, and for 3, they are 282.8, −133.5, 328.9, and −39.4 kJ mol−1, respectively. The dispersion energy in both 2 and 3 is dominant due to the enhanced electronic cloud in both compounds.32
In Fig. 9, the Coulomb energy is represented by red, dispersion energy by green, and the total energy by blue for 2 and 3a. The scale factors kdisp = 0.871, krep = 0.618, kpol = 0.740, and kele = 1.057 were used to build the energy frameworks using B3LYP/6–31+G(d,p).33 The interaction energies are represented by the size of the cylinder with a bigger radius indicating a larger energy. The weaker interaction energies are omitted for clarity.
 |
| | Fig. 9 Visualization of electrostatic intermolecular interaction energies: Coulomb, dispersion, total energy, and total energy in integer along the a, b, and c axes. | |
3.4. DFT studies
3.4.1. Geometrical optimization.
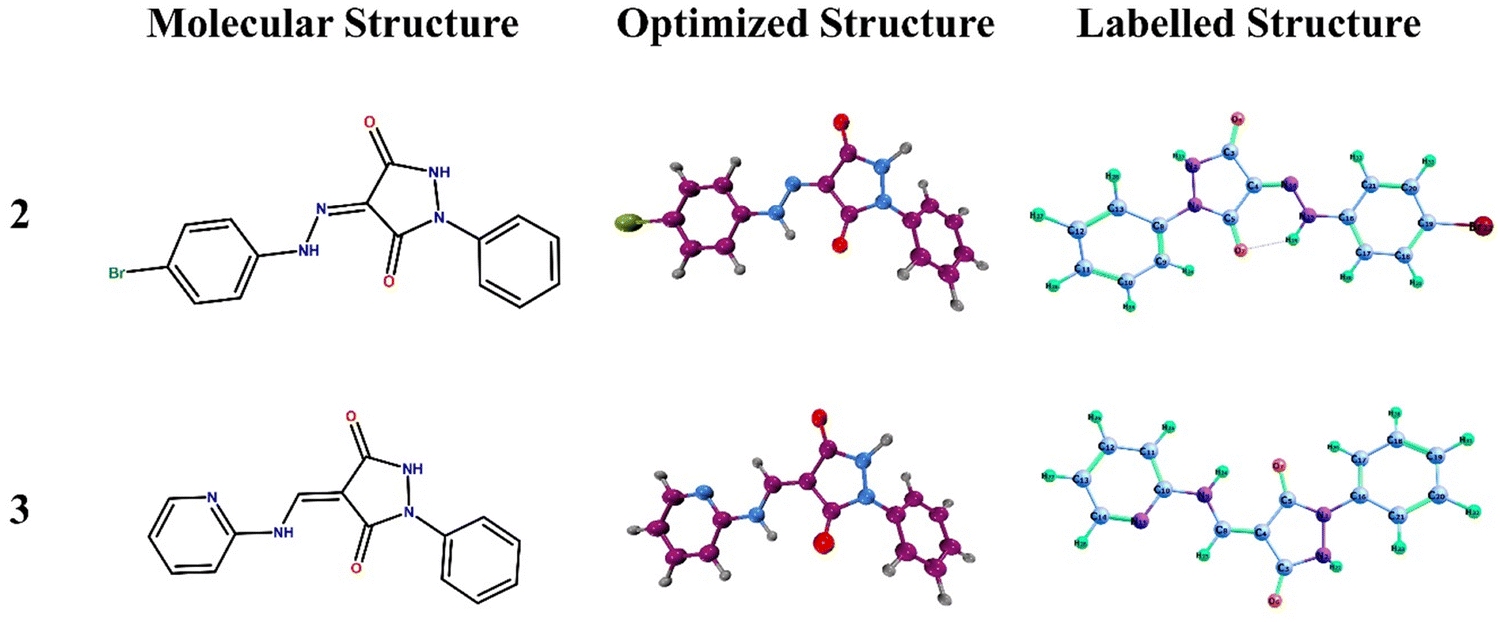
The DFT studies were performed using Gaussian 1622 and GaussView 6.0.121 along with VMD34 as well as Multiwfn35 to visualize and represent the optimized geometries, molecular electrostatic potential, and frontier molecular orbitals (Fig. 10).
 |
| | Fig. 10 Molecular structure and optimized geometry of 2 and 3. | |
3.4.2. FMO analysis.
The geometry optimization using the B3LYP functional and the 6–31+G(d,p) basis set was used to calculate EHOMO, ELUMO, and Eg (energy gap). The chemical stability of the molecules is influenced by the energies of the lowest unoccupied (LUMO) and the highest occupied (HOMO) molecular orbitals. The interactions involving the efficient transfer of charge, softness, low chemical stability, and reactivity of compounds are suggested by small energy gap values.36 The electron-donating and electron-accepting capabilities of molecules are linked to their HOMO and LUMO energy levels, respectively. Molecules with elevated EHOMO values exhibit a greater tendency to donate electrons, while those with diminished ELUMO values are more adept at accepting electrons. Consequently, a narrower energy bandgap (ΔE = ELUMO − EHOMO) enhances the interaction strength between molecules.37,38
Electronegative substituents can stabilize the HOMO by withdrawing electron density from the HOMO, which lowers its energy as seen in Table 4. This results in a smaller HOMO–LUMO energy gap while electronegative substituents can destabilize the LUMO by reducing electron density in the vicinity of the LUMO, which raises its energy. This also contributes to a smaller HOMO–LUMO energy gap. In compound 2, a more electronegative bromine atom is present, as shown in Fig. 11, which stabilizes the HOMO and thus results in a lower energy gap as compared to compound 3 which does not have a more electronegative atom than bromine.
Table 4
E
HOMO, ELUMO, and energy gap (Eg) values of 2 and 3
| Compound |
E
HOMO (eV) |
E
LUMO (eV) |
E
g (eV) |
|
2
|
−6.28 |
−2.96 |
3.32 |
|
3
|
−6.02 |
−2.31 |
3.71 |
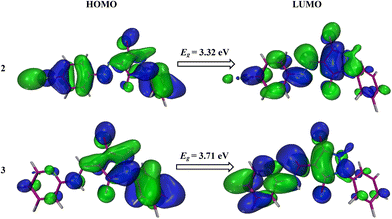 |
| | Fig. 11 Pictorial representation of HOMOs and LUMOs of 2 and 3. | |
3.4.3. MEP analysis.
The molecular electrostatic potential is a measurement of the total electrostatic force resulting from the combined distribution of protons and electrons at a particular place in a molecule. It helps determine important molecular characteristics like dipole moment, electronegativity, and chemical reactivity. The sizes and forms (positive or negative) of charges in the molecule and sites of a chemical reaction can be indicated by a map of molecular electrical potential with an iso-density surface. In the case of 2, there is a high electronic charge density around the bromine atom and the carbonyl oxygen as indicated by the red color. This indicates the potential for attack by electrophiles and a tendency for further reactions. Electron-deficient areas are indicated by blue patches while those with zero electrostatic potential are indicated by green.39 Electrophilic reactivity is depicted in red, transitioning through yellow to orange, while nucleophilic reactivity is shown in blue, transitioning to green. The highest electron density is observed in the –CO– groups, whereas the phenyl and bicyclic groups exhibit regions prone to nucleophilic attack, as illustrated in Fig. 12. These findings are essential for comprehending the interplay between a compound's electrophilic and nucleophilic reactivity. The identified reactive electrophilic and nucleophilic sites align well with FUKUI functional analysis.40
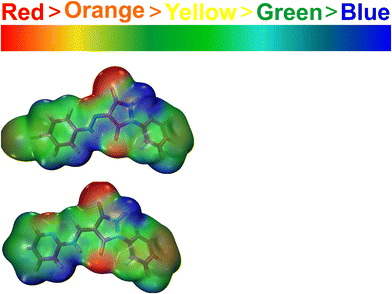 |
| | Fig. 12 MEP plots of 2 and 3 at the theoretical level DFT/B3LYP with the 6–31+G(d,p) basis set. | |
3.4.4. NBO analysis.
The use of the natural bond orbital (NBO) study increases our understanding of atomic charge in chemical systems. The net atomic charges are determined by adding up the natural atomic orbitals during this analysis. These charges may be used to determine several quantum properties including the ability to predict dipole moments and polarizations of molecules. Second-order perturbation theory was used to generate the donor and acceptor orbitals and stabilization energy values.41 The orbital overlap that occurs between the bonding and antibonding orbitals results in interactions within a molecule, which in turn cause intermolecular charge transfer (ICT) and system stability. The corresponding bonds are weakened by these interactions, which show up as greater electronic charge density in the antibonding orbital.42,43 The computed natural bond orbital charges are given in Table 5.
Table 5 NBO charges for 2 and 3
| Donor (i) |
Acceptor (j) |
E (2) kcal mol−1 |
E (j)–E (i) a.u |
F (i, j) a.u |
| Compound 2 |
| π* N15–C16 |
π* C20–C21 |
77.54 |
0.08 |
0.095 |
| LP (1) C19 |
π* C17–C18 |
59.52 |
0.16 |
0.105 |
| π C20–C21 |
LP (1) C19 |
53.98 |
0.11 |
0.089 |
| π C20–C21 |
π* N15–C16 |
34.38 |
0.2 |
0.086 |
| LP (2) O6 |
σ* N2–C3 |
30.62 |
0.63 |
0.126 |
| Compound 3 |
| LP (2) N15 |
π* N9–C10 |
187.1 |
0.13 |
0.138 |
| π C13–C14 |
LP (2) N15 |
75.27 |
0.07 |
0.088 |
| π* N9–C10 |
π* C11–C12 |
73.68 |
0.08 |
0.091 |
| π C11–C12 |
π* N9–C10 |
37.23 |
0.21 |
0.089 |
| LP (2) O6 |
σ* N2–C3 |
30.38 |
0.63 |
0.126 |
Hyper-conjugative interactions involving C–O, C–N, and C–C within molecules with the antibonding C–N, C–O, and C–C bonds assist in stabilizing particular ring parts. In 2, the interaction energies between π* C8–C13 and π* C11–C12 lead to the highest stabilization of 243.97 kJ mol−1. Further conjugation with the antibonding orbital of π* CN15–C16 as an acceptor and π C20–C21 as a donor results in a significant delocalization of 34.38 kJ mol−1. The resonance-related interaction involves electron donation from LP (1) C19 and LP (2) O6 to the antibonding acceptors π* C17–C18 and σ* N2–C3, leading to moderate stabilization energies of 59.52 kJ mol−1 and 30.62 kJ mol−1. Evidently, the electron transfers from the lone pair orbital of LP (1) C19 for 2 and LP (2) N15 for 3 to adjacent antibonding orbitals are the primary factors driving the formation of “non-Kekule” resonance structures. Minor contributions to compounds 2 and 3, from the “in-plane” interactions between the lone pair orbital LP (2) O6 and the antibonding orbital σ* N2–C3 are also observed. The resonance-related interaction involves the antibonding acceptors π* N9–C10 receiving electron donation from π C11–C12 resulting in a significant stabilization energy of 187.1 kJ mol−1 for 3. The interaction energies between π* N9–C10 and π* C11–C12 lead to a stabilization energy value of 73.68 kJ mol−1.44
The system's stability is directly proportional to the degree of electron delocalization linked with hyperconjugation. The NBO analysis highlights the significance of hyper-conjugative interactions and quantifies their stabilization energies, providing valuable insights into the molecular stabilities of 2 and 3. The most reactive locations in π-electron systems can be found using molecular orbital energies, which are also essential for comprehending different conjugated system reactions. Our NBO analysis was primarily conducted to investigate the degree and impact of electronic delocalization within the pyrazole fragment on the molecular geometry of the compounds under study. The delocalization of the π bonds within the pyrazole ring is linked to its aromatic nature. In this study, it is evident that the π C20–C21 bond is more acidic than the π C11–C12 bond. This deviation from the typical diene character is demonstrated by the π C20–C21 to π* N15–C16 and π C11–C12 to π* N9–C10 interactions, which contribute 34.38 and 37.23 kcal mol−1, respectively.45
3.5. Medicinal characterization
The gastrointestinal tract is mainly involved in the digestion and absorption of nutrients, along with the excretion of waste products.46 The blood–brain barrier (BBB) prevents entry into the brain of most drugs from the blood. The presence of the BBB makes the development of new treatments for brain diseases or new radiopharmaceuticals for neuroimaging of the brain challenging. All the products of biotechnology are large-molecule drugs that do not cross the BBB, and while it could be assumed that small molecules are freely transported across the BBB, in fact, ∼98% of all small molecules are not transported.47 The data in Table 6 indicate that both molecules have high GI absorption, suggesting that the molecules should be available in the bloodstream in good concentrations. Passive diffusion is the process via which medication absorption occurs. This process, which follows the concentration gradient to attain equilibrium, involves the movement of drug molecules from a higher drug concentration to a lower concentration following the Fick Law of diffusion. For the BBB permeation evaluation, both 2 and 3 showed negative values for that descriptor which indicated that although these compounds have high GI absorption, they will not be able to cross the BBB. P-gp (MDR1, ABCB1) mediates the ATP-dependent export of drugs from cells. As with all ABC-transport proteins, the ABC region of P-gp binds and hydrolyzes ATP and the protein uses the energy for the transport of its substrates across the membrane.48 In this study, both compounds were non-substrates of this protein causing little efflux of the drug from the target cell thus consequently a sufficient concentration, which is necessary for a physiological response, will stay in the cell. Another descriptor, log![[thin space (1/6-em)]](https://www.rsc.org/images/entities/char_2009.gif) kp, which represents the skin permeation coefficient, provides insight into the ability of a compound to penetrate through the skin and being available through the dermal route. Generally, a negative logkp value for a drug suggests its limited skin penetration, with a greater negative value indicating reduced permeation potential.49 Both 2 and 3 have logkp values in the optimal range set for skin permeation so are applicable via the dermal administration. Activation of PPAR-γ causes insulin sensitization and enhances glucose metabolism, whereas activation of PPAR-β/δ enhances fatty acid metabolism. Thus, the PPAR family of nuclear receptors plays a major regulatory role in energy homeostasis and metabolic functions, whereas antagonists of PPAR-γ may have utility in conditions like cancer, where PPAR-γ activation promotes tumor growth.50 The data indicate that 2 has an output value of 0.861 and is a stronger inhibitor of PPAR-γ as compared to 3 with an inhibition probability of 0.637, thus confirming the anticancer role of the synthesized derivatives. Acute systemic toxicity testing identifies the potential for a chemical to cause adverse effects distant from the entry point after exposure to a single dose. Several regulatory agencies use acute systemic toxicity data for hazard classification and labeling of products to alert handlers and consumers to potential toxicity hazards.51 According to the acute toxicity rule, both compounds have no toxicity risks as drug candidates.
kp, which represents the skin permeation coefficient, provides insight into the ability of a compound to penetrate through the skin and being available through the dermal route. Generally, a negative logkp value for a drug suggests its limited skin penetration, with a greater negative value indicating reduced permeation potential.49 Both 2 and 3 have logkp values in the optimal range set for skin permeation so are applicable via the dermal administration. Activation of PPAR-γ causes insulin sensitization and enhances glucose metabolism, whereas activation of PPAR-β/δ enhances fatty acid metabolism. Thus, the PPAR family of nuclear receptors plays a major regulatory role in energy homeostasis and metabolic functions, whereas antagonists of PPAR-γ may have utility in conditions like cancer, where PPAR-γ activation promotes tumor growth.50 The data indicate that 2 has an output value of 0.861 and is a stronger inhibitor of PPAR-γ as compared to 3 with an inhibition probability of 0.637, thus confirming the anticancer role of the synthesized derivatives. Acute systemic toxicity testing identifies the potential for a chemical to cause adverse effects distant from the entry point after exposure to a single dose. Several regulatory agencies use acute systemic toxicity data for hazard classification and labeling of products to alert handlers and consumers to potential toxicity hazards.51 According to the acute toxicity rule, both compounds have no toxicity risks as drug candidates.
Table 6 Evaluation of various physiological behaviors based on physiochemical characteristics
| Compounds |
GI absorption |
BBB permeant |
P-gp substrate |
Logkp (skin permeation) cm s−1 |
NR-PPAR-gamma |
Acute toxicity rule |
|
2
|
High |
No |
No |
−6.75 cm s−1 |
0.861 |
0 |
|
3
|
High |
No |
No |
−5.87 cm s−1 |
0.637 |
0 |
A measure of drug-likeness based on the concept of desirability is called a quantitative estimate of drug likeness (QED). The empirical rationale of QED reflects the underlying distribution of molecular properties.52 An attractive drug is characterized by a QED score of > 0.67. Compounds 2 and 3 had QED scores of 0.819 and 0.826, respectively, thus indicating that both have good chances to be drug candidates with all properties favorable because their scores were in an optimal range for attractive drugs. The NP score reflects the natural product-likeness which is expected to range from −5 to 5; the higher the score, the higher the probability of being a natural product as natural products are more likely to be safe with reduced risk of toxicity.53 The data presented in Table 7 show that 2 and 3 have values in the optimal range and that these compounds should be safe drug candidates. Caco-2 cells are a human colon epithelial cancer cell line used as a model of human intestinal absorption of drugs and other compounds.54 Compound 2 has a Caco-2 Permeability range of −5.301 which was higher than the optimal range set for the Caco-2 Permeability indicating it is suitable for oral dosing. Compound 3 has the value −4.622 which was less than the range indicating that it is not suitable for oral dosing. The Madin–Darby canine kidney (MDCK) cell line is widely used as an epithelial cell model in studies ranging from viral infection to environmental pollutants and vaccine production.55 The Madin–Darby canine kidney (MDCK) permeability score was 0.01 cm s−1 which is within the acceptable limit. The standard scores for low permeability, medium permeability, and high passive permeability are < 2 × 10⁻⁶ cm s−1, 2–20 × 10−6 cm s−1, and > 20 × 10−6 cm s−1, respectively.53 Compounds 2 and 3 have medium MDCK permeability values indicating that they have medium rate permeability. Plasma protein binding plays a key role in drug therapy that affects the pharmacokinetics and pharmacodynamics of drugs and may affect the metabolism of drugs.56 The optimal range of PPB is < 90% because highly protein-bound drugs may have a low therapeutic index.53 Both 2 and 3 have a greater than 90% range for PPB indicating that both present risks and/or low effectiveness.
Table 7 Drug likeness, natural product-likeness, permeations, and plasma protein binding analyses of 2 and 3
| Compounds |
QED |
SA score |
NP score |
Caco-2 Permeability |
MDCK Permeability |
PPB (%) |
|
2
|
0.819 |
2.431 |
−1.496 |
−5.301 |
1.70E-05 |
96.43 |
|
3
|
0.826 |
2.315 |
−1.398 |
−4.622 |
1.40E-05 |
99.72 |
CYP1-3 functions primarily to metabolize several antipsychotic medications and theophylline and environmental and genetic factors are shown to influence its activity.57 The data in Table 8 indicate that 2 and 3 can be good CYP1-3 inhibitors because the probabilities of inhibition were found to be 0.721 and 0.729, respectively, however, 3 has a risk of being a substrate of this enzyme with a probability of 0.805. CYP2C19 is the principal enzyme involved in the hepatic metabolism of drugs such as antimalarials (e.g. proguanil), oral anticoagulants (e.g. R-warfarin), chemotherapeutic agent (e.g. cyclophosphamide), anti-epileptics (e.g. S-mephenytoin, diazepam, and phenobarbitone), antiplatelets (e.g. clopidogrel), proton pump inhibitors (e.g. omeprazole, pantoprazole, lansoprazole, and rabeprazole), antivirals (e.g. nelfinavir), and antidepressants (e.g. amitriptyline and clomipramine). The gene encoding CYP2C19 is located on chromosome 10q24, and currently 35 polymorphisms are known in the CYP2C19 gene.58 Compound 3 with a probability of 0.84 was found to be a better CYP2C19 inhibitor as compared to 2 but both were estimated to be non-substrates. The enzyme CYP2C9 is involved in the metabolic elimination of S warfarin.58 Compound 2 with an inhibition probability of 0.492 was found to be a poor inhibitor of the CYP2C9 protein but a better substrate during metabolic transformations, whereas the probability of 3 was found to be high as an inhibitor of this metabolic enzyme. The CYP2D6 enzyme catalyzes the metabolism of many clinically important drugs including antidepressants, neuroleptics, some antiarrhythmics, lipophilic β-adrenoceptor blockers, and opioids.59,60 Compounds 2 and 3 were found to be neither good CYP2D6 inhibitors nor better substrates. CYP3A4 is responsible for 40% to 45% of all phase-I metabolism and accounts for up to 70% of gastrointestinal CYP activity. CYP3A4 is co-expressed with PGP in the liver and intestines but unfortunately, both 2 and 3 were found to be non-inhibitors of this enzyme.57 Most of the hERG channel blockers have a tertiary amine group that is protonated at physiological pH and plays an important role in the binding of the channel blocker and hERG channel, as well as aromatic rings which are associated with π-stacking or hydrophobic interactions with aromatic rings of amino acids within the hERG channel cavity.61 Both 2 and 3 have a range of less than 0.3 indicating that they have no probability of being active compounds and therefore they were found to be less toxic in this respect. From the AMES toxicity values, 2 is predicted to have a low toxicity while that of 3 is moderate.
Table 8 Estimation of the inhibitory potential of the CYP enzyme family and toxicity of 2 and 3
| Compounds |
CYP1-3 inh/sub |
CYP2C19 inh/sub |
CYP2C9 inh/sub |
CYP2D6 inh/sub |
CYP3A4 inh/sub |
hERG Blockers |
AMES Toxicity |
|
2
|
0.721/0.538 |
0.268/0.334 |
0.492/0.951 |
0.003/0.133 |
0.029/0.398 |
0.012 |
0.232 |
|
3
|
0.729/0.805 |
0.84/0.488 |
0.859/0.626 |
0.026/0.112 |
0.168/0.576 |
0.005 |
0.762 |
3.6. Metabolism evaluation
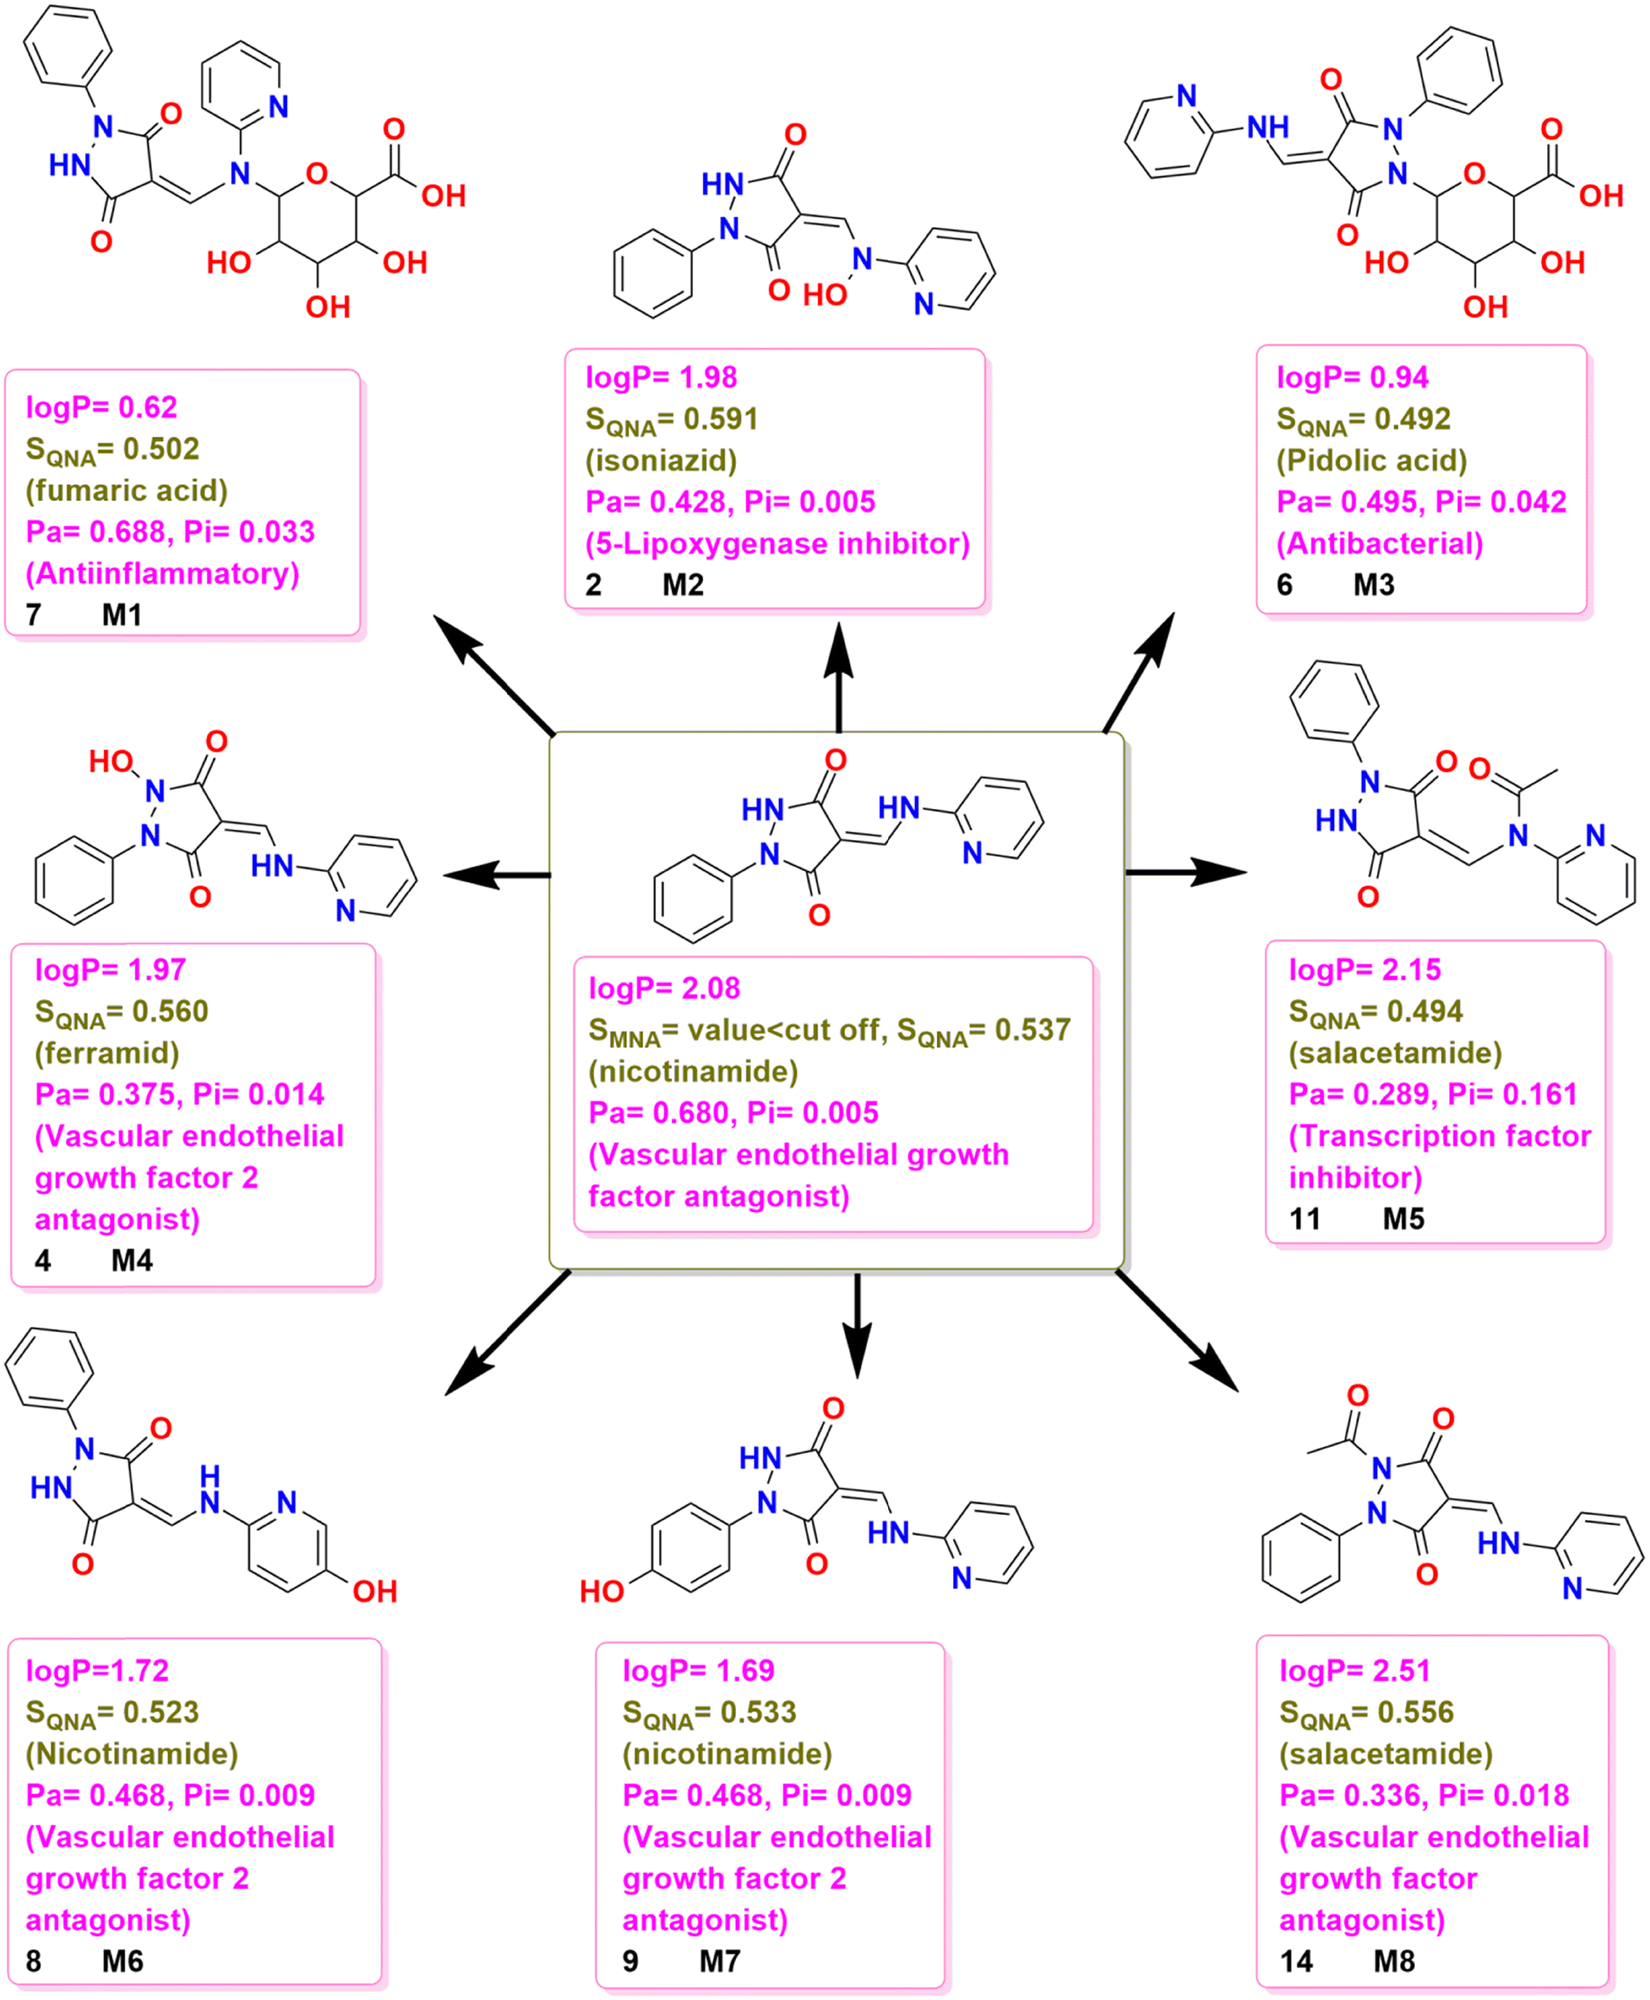
LogP is widely used in drug discovery and development as an indicator of the potential utility of a solute as a drug. Lipinski produced the “Rules of 5”, describing what a new small molecule drug should be like to be a candidate for oral administration. One of these rules states that logP should be between 0 and 5.62,63 Compound 3 was selected for possible metabolism testing and has a logP value of 2.08 which shows that it is a polar molecule. The metabolites M1, M2, M3, M4, M5, M6, M7, and M8 (Fig. 13) were proposed to be formed in the metabolic transformations based on likely chemical reactions. Since the values of logP are inversely related to the polarity of the molecule, the data in Fig. 13 show that the metabolites M1, M2, M3, M4, M6, and M7 are more polar than 3 while the metabolites M5 and M8 were less polar than 3. Furthermore, the medicinal potential investigation of 3 showed that it was a vascular endothelial growth factor antagonist and a vascular endothelial growth factor 2 antagonist. Furthermore, the study of the metabolites M1, M2, M3, M4, M5, M6, M7, and M8 of 3 using the Pa values given in Fig. 13 indicate anti-inflammatory activity for M1 as well as biological activity for the tumour necrosis factor-alpha release inhibitor. The metabolite M2 has a biological activity for a 5-lipoxygenase inhibitor and also has an activity for a lipoxygenase inhibitor while M3 has modest antibacterial and anti-inflammatory activity. The metabolites M4, M6, M7, and M8 have biological activity for the vascular endothelial growth factor 2 antagonist and while M6 and M7 have the same Pa values, these are smaller than that of 3. Again, like 3, M4, M6, M7, and M8 also have biological activity for vascular endothelial growth factor antagonists (Fig. 13).
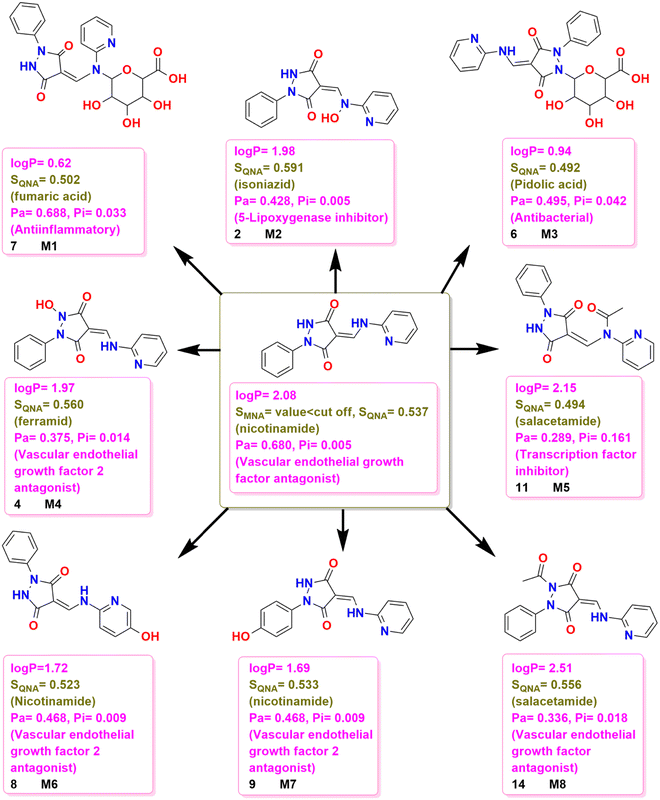 |
| | Fig. 13 Possible chemical transformations of 3 along with the evaluation of polarity, drug likelihood, and physiological potential of the resulting compounds. | |
In the comparative study of structural relationships with known drugs based on SQNA values (Fig. 13), 3 was found to have a structural similarity to the world-approved drug nicotinamide while M1 had a structural similarity to fumaric acid and M2 had a structural similarity to the world-approved drug isoniazid. Furthermore, M3 had a structural similarity to pidolic acid, M4 showed a structural similarity to the world-approved drug ferramid, M5 and M8 showed structural similarity to sulfacetamides and M6 and M7 have structural similarities to the world-approved drug nicotinamide, however, their structural similarity score was less than that of 3.
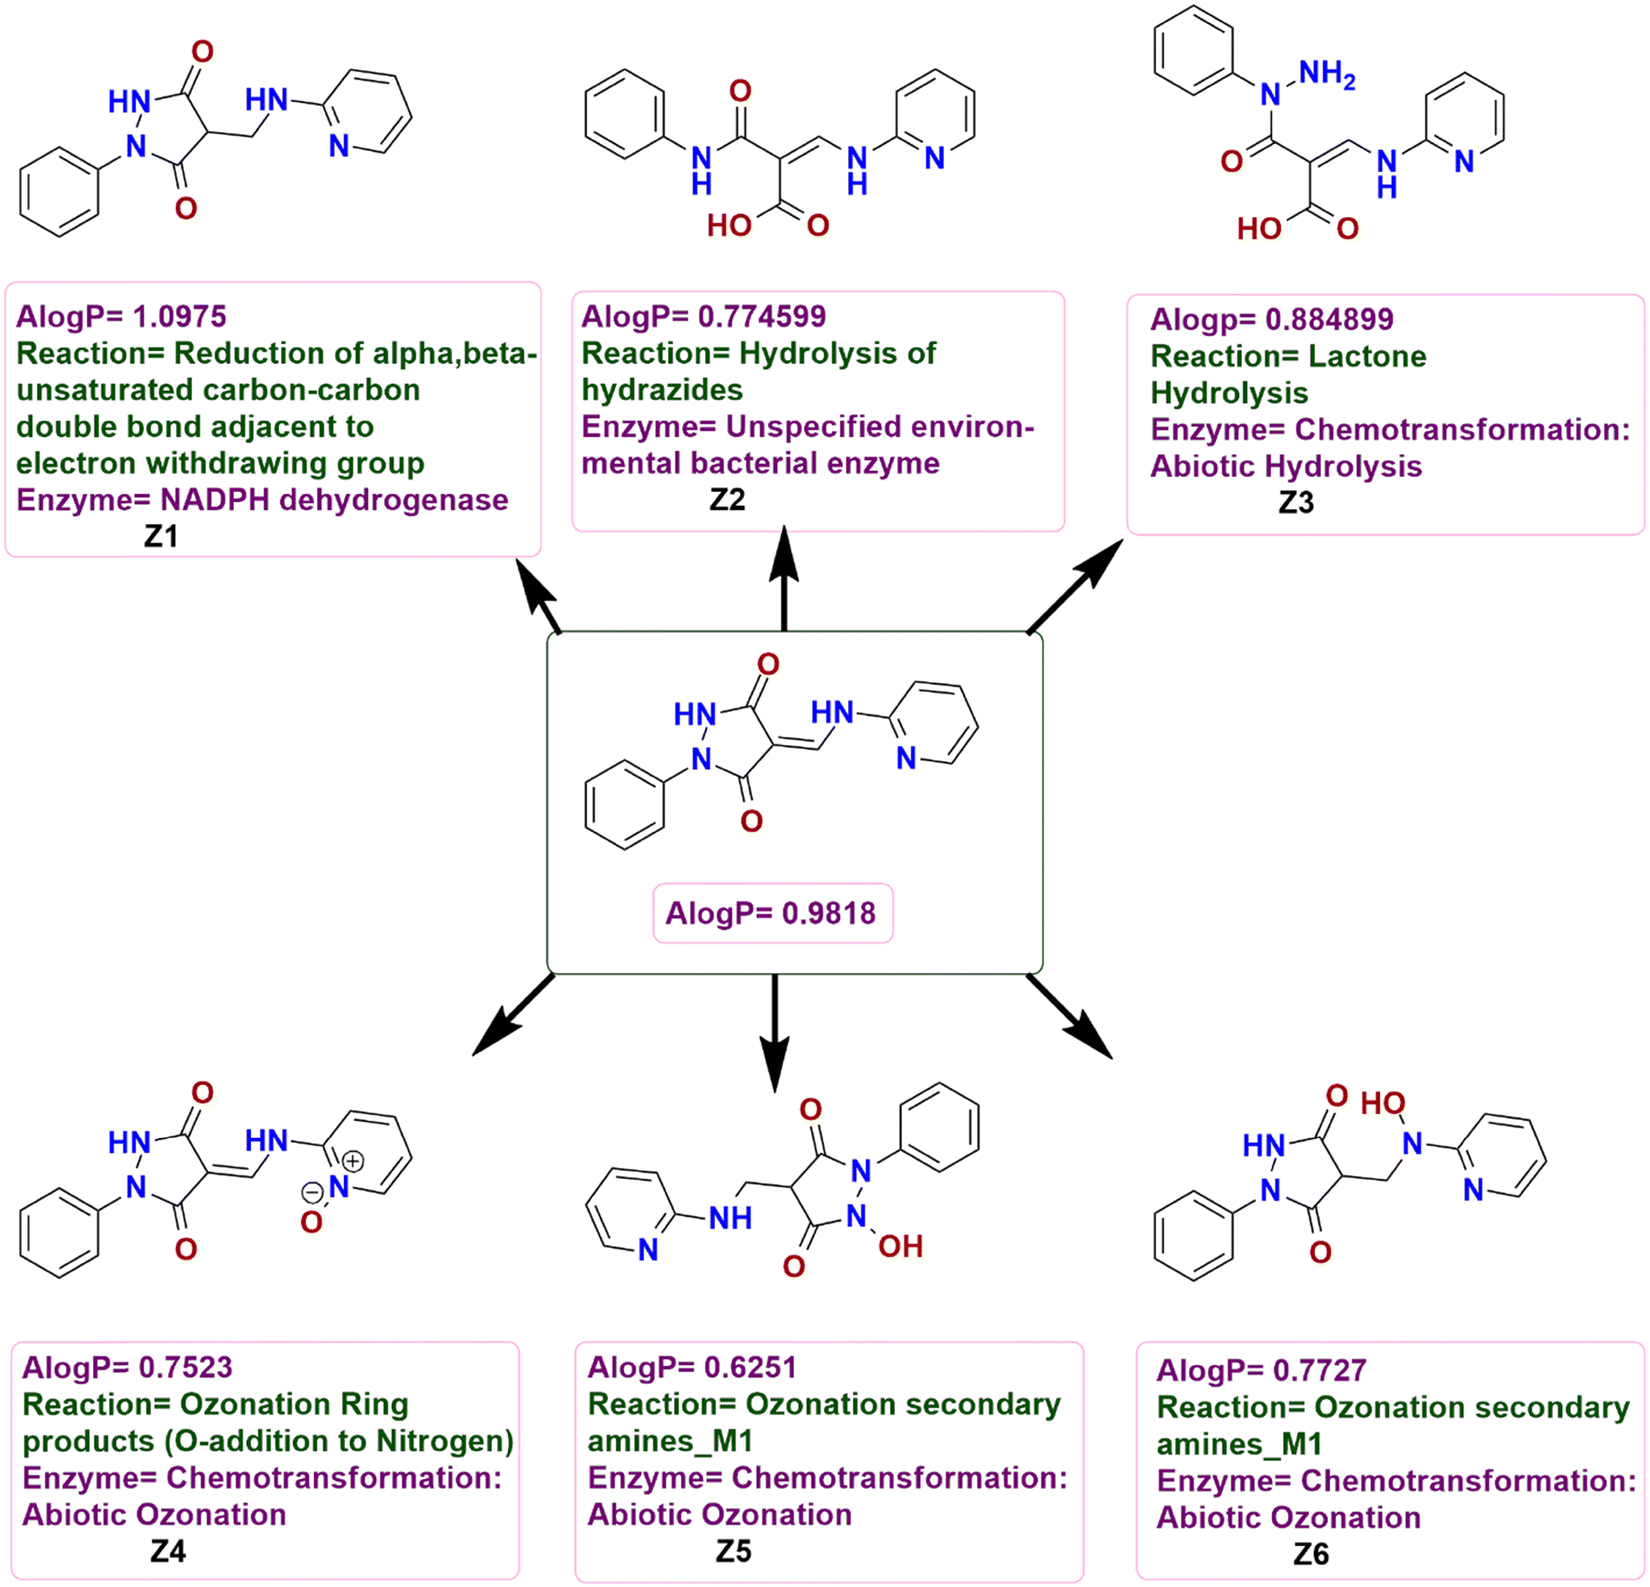
Compound 3 was analyzed for metabolic reactions using another algorithm BioTransformer 3.0 and the resulting metabolites Z1, Z2, Z3, Z4, Z5, and Z6 were formed. The AlogP value obtained for 3 was 0.9818 showing it to be polar. Based on the A![[thin space (1/6-em)]](https://www.rsc.org/images/entities/i_char_2009.gif) logP values presented in Fig. 14, Z1 is less polar than 3 while the remainder of the metabolites was more polar than 3 with Z3 slightly more polar and the rest increasing in polarity in the order Z2 < Z6 < Z4 < Z5.
logP values presented in Fig. 14, Z1 is less polar than 3 while the remainder of the metabolites was more polar than 3 with Z3 slightly more polar and the rest increasing in polarity in the order Z2 < Z6 < Z4 < Z5.
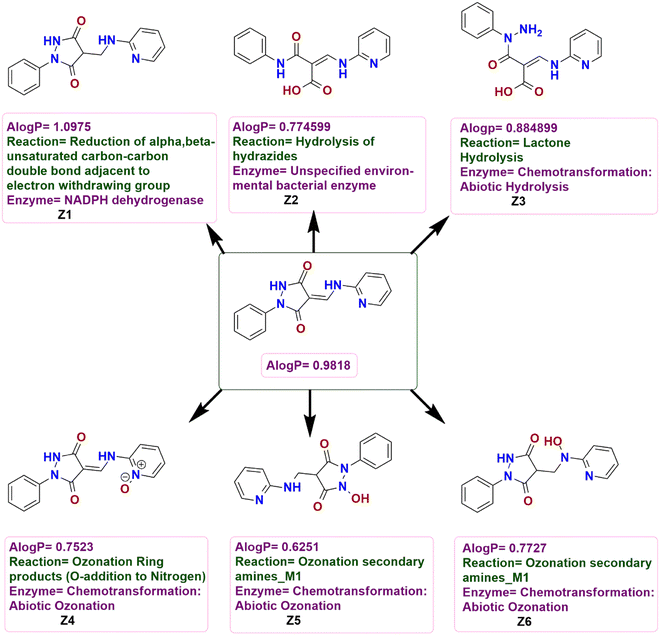 |
| | Fig. 14 Possible chemical transformations of 3 along with the evaluation of polarity and metabolic reactions and prediction of enzymes involved in these transformations. | |
Considering the potential chemical transformations, 3 undergoes a reduction of the CC bond of the α,β-unsaturated carbonyl fragment adjacent to the electron-withdrawing group with the help of the NADPH dehydrogenase enzyme to form Z1 while Z2 could be formed by the hydrolysis of the hydrazide functionality. An abiotic hydrolysis of the lactone could give Z3 while N-oxide Z4 could be formed by the oxidation of the nitrogen atom of the pyridine ring of 3 and an abiotic ozonation of the secondary amines could form Z5 and Z6 (Fig. 14).
3.7. Molecular docking
The process of computationally predicting the preferred orientation of a molecule inside a target binding site is essential to drug design and discovery because it enables the analysis and optimization of possible therapeutic candidates.64,65 Through the simulation of small molecule-target protein interactions, molecular docking provides binding affinities and clarifies the possible efficacy of that molecule. This greatly expedites the drug development process by providing guidance for compounds with high binding scores and therapeutic potential.66–68
Among the proteins employed in molecular docking analyses, HER2 promotes the rapid growth of breast cancer cells, and HER2-positive breast cancer cells have HER2 levels that are greater than average. Compared to HER2-negative breast cancers, these tumors often develop and spread more quickly, but they also have a higher propensity to react to therapy with medications that target the HER2 protein.69 The breast cancer is primarily driven by the activated form of this enzyme, which gives the cell strong proliferative and anti-apoptotic signals. When demonstrated to be overexpressed or amplified using suitable techniques, HER2 represents a valuable target for therapy.70 Another protein tyrosine kinase known as the epidermal growth factor receptor (EGFR) is activated by ligand interaction, overexpression, or mutation. Its tyrosine kinase-dependent carcinogenic properties in a range of human malignancies are widely known.71 Suppression of signal transduction pathways that regulate tumor cell growth, proliferation, and resistance to apoptosis is achieved by targeted suppression of EGFR activity. Among the most popular EGFR-targeting medications, small-molecule tyrosine kinase inhibitors and monoclonal antibodies have been utilized in clinical trials to treat a variety of cancers.72 Furthermore, in addition to hydrolyzing 3′-phosphotyrosyl residues, Tdp1 can promiscuously handle multiple blocked 3′ ends produced by nucleoside analogs and DNA damaging agents. Furthermore, a lack of these enzymes results in an increased susceptibility to anti-tumor topoisomerase toxins. TDP1 is therefore also an interesting therapeutic target, and it is anticipated that its inhibitors will greatly enhance the impact of the anti-tumor medicines currently in use, such as topoisomerase poisons and other compounds that damage DNA.73
Therefore, these cancer-related proteins, namely, the extracellular domain of the Tdp1 receptor, human EGFR and HER2–were chosen to test the potency of pyrazolidine-3,5-dione derivatives 2 and 3. Docking simulations showed that both were promising candidates according to the data shown in Table 9.
Table 9 Molecular docking binding energies for 2 and 3 for three target substrates PDB IDs: 3WSQ, 5WB7, and 6N0D
| S. no |
Compound |
Protein |
Binding energy (kcal mol−1) |
Ligand efficiency (kcal mol−1) |
Inhibition constant (μM) |
Intermol. energy (kcal mol−1) |
| 1 |
2
|
3WSQ
|
−6.59 |
−0.3 |
14.77 |
−7.49 |
| 2 |
5WB7
|
−6.12 |
−0.28 |
32.41 |
−7.02 |
| 3 |
6N0D
|
−6.63 |
−0.3 |
13.72 |
−7.53 |
| 4 |
3
|
3WSQ
|
−6.24 |
−0.3 |
26.6 |
−7.43 |
| 5 |
5WB7
|
−5.91 |
−0.28 |
46.39 |
−7.11 |
| 6 |
6N0D
|
−6.26 |
−0.30 |
25.68 |
−7.46 |
Analysis of the ligand–protein complex of 2 with the target HER2 protein showed that the amino acid residues ARG A:434, SER A:435, LEU A:436, ARG A:437, GLN A:462, LEU A:463, TRP A:499, PRO A:503, THR A:504, GLN A:505, CYS A:506, VAL A:507, ASN A:508, CYS A:509, LEU A:513, GLN A:516, CYS A:518, and HIS A:537 were present in the binding pocket among which ARG A:434, ARG A:437, CYS A:506, VAL A:507, CYS A:509, LEU A:513, and CYS A:518 were interacting with the ligand molecules. Of these, ARG A:434 was the only one which bound 2 at various positions including a HB (2.27 Å) between the carbonyl oxygen of amino acid and the polar hydrogen atom of the NH group of the hydrazone moiety and two π–alkyl interactions (4.85 and 4.90 Å) of the alkyl chain of this amino acid with the pyrazolidinedione and adjacent phenyl ring, while, a carbonyl oxygen of the pyrazolidinedione moiety created an intramolecular HB (2.22 Å) with the hydrogen atom of the adjacent hydrazone fragment. ARG A:437, having a π–alkyl interaction (4.29 Å) with the bromine-containing phenyl ring, was present almost in front of the VAL A:507 which was involved in a π–σ interaction (3.92 Å) with the opposite face of the phenyl ring of the ligand molecule. Besides this, various π–alkyl interactions were formed by the electronic cloud of the other phenyl ring with CYS A:506 (5.45 Å), CYS A:509 (4.90 Å), LEU A:513 (4.59 Å), and CYS A:518 (5.15 Å). Compound 2 was also docked with another cancer protein (EGFR) to analyze the binding potential and numerous binding interactions were identified among which the most prominent was an intermolecular HB (2.50 Å) between the oxygen atom of the carboxylate functionality of GLU A:60 and the NH group of the hydrazone moiety of 2, another intermolecular HB (2.71 Å) of NH of the guanidine group of ARG A:84 with a carbonyl oxygen atom of the pyrazolidinedione ring, and an intramolecular HB (2.31 Å) between the carbonyl oxygen and the NH group of the hydrazone functionality. Furthermore, the key interactions between the same amino acid already involved in creating HBs included a π–cation interaction between the NH group of the guanidine moiety of ARG A:84 and the electronic cloud of the pyrazolidinedione ring of 2 where this electronic cloud was simultaneously involved in a π–anion interaction with the carboxylate ion of GLU A:60. Additionally, VAL A:226 and CYS A:227 were bound with the aromatic cloud of the bromophenyl ring through π–alkyl attractions (4.46 and 5.35 Å) thus establishing the role of these amino acid residues in holding 2 in the binding pocket of the macromolecule. The remainder includes a π–cation interaction (4.13 Å) between ARG A:231 and the phenyl ring, two π–Sigma interactions (3.65 and 3.87 Å) between VAL A:36 and the phenyl ring, a π–alkyl interaction (5.19 Å) between VAL A:6 and the electronic cloud of the phenyl ring, a π–alkyl interaction (4.48 Å) between ARG A:231 and the pyrazolidinedione, and a π–alkyl interaction (5.23 Å) between the ARG A:231 and the bromophenyl moiety. The complex of 2 was stabilized by the creation of numerous interactive forces between the counterparts including an intermolecular HB (2.43 Å) between the doubly bonded nitrogen atom of the hydrazone moiety and a nitrogen atom of the imidazole ring of HIS A:343, another intermolecular HB between the NH group of the pyrazolidindione and the carboxylate anion of GLU A:314, and an intramolecular HB was formed by the carbonyl oxygen of heterocyclic ring with the NH group of the hydrazone functionality where the oxygen atom of the carboxylate anion of GLU A:314 was engaged with the phenyl ring through a π–anion linkage (4.68 Å) and the electronic cloud of the imidazole ring of HIS A:343 was linked to the bromophenyl ring through a π–π stacked linkage (5.16 Å) along with numerous van der Waals forces between the amino acid residues and the various functional parts of 2.
Compound 3 formed a stable complex with the HER2 substrate by occupying a binding pocket distinct from that used by 2 due to energy considerations where the amino acids playing the key role in binding the guest molecule included ARG H:100 by the formation of a π–cation interaction (4.18 Å) with the electronic cloud of the phenyl ring, PHE A:359 forming an important conventional HB (2.89 Å) through its carbonyl oxygen atom with the NH of the aminomethylene moiety, PRO A:369 forming a π–alkyl interaction (5.00 Å) with the electronic cloud of the pyridyl ring, ALA A:392 with a π–σ interaction (3.84 Å) binding the phenyl ring of 3, and ASP A:395 binding the NH linkage of the pyrazolidinedione ring where an intramolecular HB was present between the NH of the aminomethylene moiety and a carbonyl oxygen atom of the pyrazolidinedione ring. The binding pocket occupied by 3 is adjacent to the cavity occupied by 2 with the variation that the former is bound at the interface of chains A and D while the latter is bound only by chain A. The important amino acids for binding 3 include LEU D:243 to form a conventional HB (2.50 Å) with a carbonyl oxygen atom of the pyrazolidinedione, MET D:244 to associate the same oxygen atom through an HB (1.56 Å) by its NH group, also connecting (2.49 Å) with the NH group of the aminomethylene moiety by its carbonyl moiety and formation of a donor–donor interaction (2.63 Å) by the NH group of the amino acid and the NH group of the aminomethylene moiety of 3 MET D:253 creates π–σ (3.67 Å) and π–sulfur (4.23 Å) interactions simultaneously with the electronic cloud of the pyridyl ring, and ASP D:279 generates another conventional HB (2.26 Å) with the NH group of the pyrazolidinedione ring while LEU D:243 and MET D:244 form weak π–alkyl interactions (3.94 and 5.10 Å) with the phenyl ring of 3 and all these interactions show the importance of the central part and the heteroatoms of 3 to occupy this binding pocket of the protein molecule. A complex of 3 with the catalytic domain of Tdp1 protein was formed after inserting 3 into the binding cavity with the amino acid residue GLU A:445 forming a conventional HB with the NH group, TYR A:454 and ALA A:597 forming conventional HBs (2.56 and 2.22 Å) with one of the carbonyl oxygen atoms of the pyrazolidinedione ring, LYS A:596 forming a HB (3.09 Å) with the nitrogen atom of the pyridine ring, VAL A:444 and GLU A:445 establishing two π–cation interactions with the electronic cloud of the phenyl ring, and TYR A:594 and LYS A:596 creating π–alkyl interactions with the pyridyl moiety along with numerous other interactions of the amino acid residues with the ligand molecule shown in Fig. S2 (ESI†). In conclusion, both 2 and 3 formed stable ligand–protein complexes with good binding energies thus establishing their anticancer potential (Fig. 15 and Table 10).
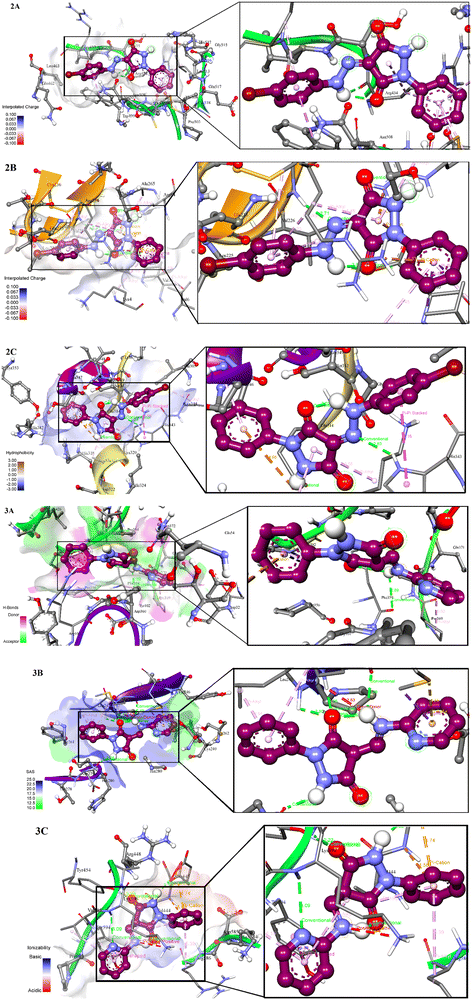 |
| | Fig. 15 Three-dimensional representations of the binding pockets of ligand–protein complexes, mode of binding, binding interactions, and conformations adopted by the ligands in the bound state. | |
Table 10 Analysis of hydrogen bonds of 2 and 3 with the amino acid residues in the binding pockets of the target substrates
| Ligand |
Protein |
Hydrogen bonding |
HB parameters |
|
2
|
6N0D
|
Glu314-ligand1:H (H of NH group of pyrazolidinedione ring) |
Bond length: 1.943 Å |
|
Θ (don-h- > acc): 133.278° |
|
Φ (h- > acc-accN): 141.959° |
| Bond energy: −1.309 KJ mol−1 |
|
3
|
3WSQ
|
ASP395-ligand1:H (H of NH group of pyrazolidinedione ring) |
Bond length: 2.247 Å |
|
Θ (don-h- > acc): 151.038° |
|
Φ (h- > acc-accN): 107.113° |
| Bond energy: −2.581 KJ mol−1 |
|
3
|
5WB7
|
D:MET244:NH-ligand:O (O of carbonyl functionality of pyrazolidinedione ring) |
Bond length: 1.563 Å |
|
Θ (don-h- > acc): 163.251° |
|
Φ (h- > acc-accN): 172.202° |
| Bond energy: 0.003 KJ mol−1 |
|
3
|
6N0D
|
A:VAL595:HN-ligand:N (N of pyridyl ring) |
Bond length: 1.944 Å |
|
Θ (don-h- > acc): 174.193° |
|
Φ (h- > acc-accN): 89.284° |
| Bond energy: −6.86 KJ mol−1 |
|
3
|
6N0D
|
A:ALA597:HN-ligand:O (O of carbonyl functionality of pyrazolidinedione ring) |
Bond length: 2.215 Å |
|
Θ (don-h- > acc): 121.806° |
|
Φ (h- > acc-accN): 155.779° |
| Bond energy: −0.197 KJ mol−1 |
4. Conclusion
To sum up, new pyrazolidine-3,5-dione derivatives were successfully synthesized and their structures were confirmed by single-crystal X-ray analysis. The Hirshfeld surface analysis provided two-dimensional fingerprint plots highlighting a prevalence of H⋯H interactions for both compounds and facilitating the identification of additional intermolecular interactions. The DFT analysis showed the electronic stability and reactivity of both of the newly synthesized molecules. A smaller band gap of 3.32 eV was shown by 2, indicating the high reactivity of this molecule. The NBO analysis reveals significant hyperconjugative interactions and electron delocalization, contributing to the stability and reactivity of the compounds. The medicinal potency evaluation of 2 and 3 showed that they are suitable candidates for the drug discovery process based on their physiochemical properties and by the validation of Lipinski, Veber, Ghose, and Muegge drug-likeness rules. The molecular docking studies were performed to validate the anticancer potential of 2 and 3 with the results indicating them to be potent inhibitors of all of the target substrates. Among the selected targets, both compounds exhibited strongest binding with the Tdp1 substrate with binding energies of −6.63 and 6.26 kcal mol−1 showing that the binding capability of compound 2 was greater than that of compound 3. The calculated ligand efficiency values for 2 and 3 against HER2, EGFR, and Tdp1 enzymes validated the stronger binding capabilities and suggested their anticancer effects. The present work corroborated the simple synthetic approach, good structural features, and favorable therapeutic potency of both of the synthetic scaffolds thus suggesting them to be suitable leads for future studies.
Data availability
The authors confirm that the data supporting the findings of this study are available within the article [and/or] its ESI.†
Conflicts of interest
There are no conflicts to declare.
Acknowledgements
The authors extend their appreciation to the Researchers Supporting Project, King Saud University, Riyadh, Saudi Arabia, for funding this work through grant No. RSP2024R353.
References
- O. A. Abbas, O. M. El-Roudi and S. A. Abdel-Latif, Appl. Organomet. Chem., 2023, 37, e7236 CrossRef CAS
 .
.
- K. Tyagi and A. Chandekar, Int. J. Drug Dev. Res., 2011, 3, 233–239 Search PubMed .
- M. M. Shahroz and H. K. Sharma, Think India J., 2019, 22, 139–146 Search PubMed .
- N. S. Abdel-Kader, S. A. Abdel-Latif, A. L. El-Ansary and M. A. Hemeda, Polycycl. Aromat. Compd., 2023, 1–32 Search PubMed .
- A. E. M. Abdallah, S. A. Abdel-Latif and G. H. Elgemeie, ACS Omega, 2023, 8, 19587–19602 CrossRef CAS PubMed .
- A. Tiwari and A. Singh, Middle-East J. Sci. Res., 2013, 17, 926–935 CAS .
- X.-Y. Zhang, Y.-F. Gu, T. Chen, D.-X. Yang, X.-X. Wang, B.-L. Jiang, K.-P. Shao, W. Zhao, C. Wang and J.-W. Wang, MedChemComm, 2015, 6, 1781–1786 RSC .
- E. M. Husseiny, H. S. Abulkhair, N. M. El-Dydamony and K. E. Anwer, Bioorg. Chem., 2023, 133, 106397 CrossRef CAS PubMed .
- B. Le Bourdonnec, E. Meulon, S. Yous, J.-F. Goossens, R. Houssin and J.-P. Hénichart, J. Med. Chem., 2000, 43, 2685–2697 CrossRef CAS PubMed .
- P. A. Channar, S. Afzal, S. A. Ejaz, A. Saeed, F. A. Larik, P. A. Mahesar, J. Lecka, J. Sévigny, M. F. Erben and J. Iqbal, Eur. J. Med. Chem., 2018, 156, 461–478 CrossRef CAS PubMed .
- F. Azimi, J. B. Ghasemi, H. Azizian, M. Najafi, M. A. Faramarzi, L. Saghaei, H. Sadeghi-Aliabadi, B. Larijani, F. Hassanzadeh and M. Mahdavi, Int. J. Biol. Macromol., 2021, 166, 1082–1095 CrossRef CAS PubMed .
- İ. Koca, A. Özgür, K. A. Coşkun and Y. Tutar, Bioorg. Med. Chem., 2013, 21, 3859–3865 CrossRef PubMed .
- P. A. Channar, A. Saeed, F. A. Larik, B. Batool, S. Kalsoom, M. M. Hasan, M. F. Erben, H. R. El-Seedi, M. Ali and Z. Ashraf, Bioorg. Chem., 2018, 79, 293–300 CrossRef CAS PubMed .
- W. Omara, S. A. Abdel-Latif, H. M. E. Azzazy and N. S. Abdel-Kader, Appl. Organomet. Chem., 2024, 38, e7439 CrossRef CAS .
- A. M. Abu-Dief, R. M. El-Khatib, T. El-Dabea, S. A. Abdel-Latif, I. O. Barnawi, F. S. Aljohani, K. Al-Ghamdi and M. A. E. A. A. A. El-Remaily, Appl. Organomet. Chem., 2024, 38, e7463 CrossRef CAS .
- H. Inac, M. Ashfaq, N. Dege, M. Feizi-Dehnayebi, K. S. Munawar, N. K. Yağcı, E. P. Çınar and M. N. Tahir, J. Mol. Struct., 2024, 1295, 136751 CrossRef CAS .
- APEX4 and SAINT, Bruker AXS LLC, Madison, WI, USA, 2021.
- L. Krause, R. Herbst-Irmer, G. M. Sheldrick and D. Stalke, J. Appl. Crystallogr., 2015, 48, 3–10 CrossRef CAS PubMed .
- G. M. Sheldrick, Acta Crystallogr., Sect. A: Found. Crystallogr., 2015, 71, 3–8 CrossRef PubMed .
- G. M. Sheldrick, Acta Crystallogr., Sect. C: Struct, Chem, 2015, 71, 3–8 Search PubMed .
-
R. Dennington, T. A. Keith and J. M. Millam, GaussView, Version 6.1, Semichem Inc., Shawnee
Mission, KS, 2016 .
-
M. J. Frisch, G. W. Trucks, H. B. Schlegel, G. E. Scuseria, M. A. Robb, J. R. Cheeseman, J. A. Montgomery, Jr., T. Vreven, K. N. Kudin, J. C. Burant, J. M. Millam, S. S. Iyengar, J. Tomasi, V. Barone, B. Mennucci, M. Cossi, G. Scalmani, N. Rega, G. A. Petersson, H. Nakatsuji, M. Hada, M. Ehara, K. Toyota, R. Fukuda, J. Hasegawa, M. Ishida, T. Nakajima, Y. Honda, O. Kitao, H. Nakai, M. Klene, X. Li, J. E. Knox, H. P. Hratchian, J. B. Cross, V. Bakken, C. Adamo, J. Jaramillo, R. Gomperts, R. E. Stratmann, O. Yazyev, A. J. Austin, R. Cammi, C. Pomelli, J. W. Ochterski, P. Y. Ayala, K. Morokuma, G. A. Voth, P. Salvador, J. J. Dannenberg, V. G. Zakrzewski, S. Dapprich, A. D. Daniels, M. C. Strain, O. Farkas, D. K. Malick, A. D. Rabuck, K. Raghavachari, J. B. Foresman, J. V. Ortiz, Q. Cui, A. G. Baboul, S. Clifford, J. Cioslowski, B. B. Stefanov, G. Liu, A. Liashenko, P. Piskorz, I. Komaromi, R. L. Martin, D. J. Fox, T. Keith, M. A. Al-Laham, C. Y. Peng, A. Nanayakkara, M. Challacombe, P. M. W. Gill, B. Johnson, W. Chen, M. W. Wong, C. Gonzalez and J. A. Pople, Gaussian 03, Gaussian Inc., Wallingford CT, 2016 .
- P. R. Spackman, M. J. Turner, J. J. McKinnon, S. K. Wolff, D. J. Grimwood, D. Jayatilaka and M. A. Spackman, J. Appl. Crystallogr., 2021, 54(3), 1006–1011 CAS .
- S. K. Mohamed, S. Karthikeyan, E. Khamies, A. Ahsin, E. Bakhite, I. S. Marae, T. I. El-Emary, J. T. Mague, A. I. Said and R. Al-Salahi, J. Biomol. Struct. Dyn., 2023, 1–15 CrossRef CAS PubMed .
- W. A. Siddiqui, M. A. Raza, A. Ashraf, M. Ashfaq, M. N. Tahir and S. Niaz, J. Mol. Struct., 2024, 1295, 136603 CrossRef .
- N. Dege, H. Gökce, O. E. Doğan, G. Alpaslan, T. Ağar, S. Muthu and Y. Sert, Colloids Surf., A, 2022, 638, 128311 CrossRef CAS .
- N. T. Pokhodylo, Y. Slyvka and V. Pavlyuk, Acta Crystallogr., Sect. E: Crystallogr. Commun., 2021, 77, 1043–1047 CrossRef CAS PubMed .
- A. Saeed, A. Khurshid, U. Flörke, G. A. Echeverría, O. E. Piro, D. M. Gil, M. Rocha, A. Frontera, H. R. El-Seedi and A. Mumtaz, New J. Chem., 2020, 44, 19541–19554 RSC .
- D. Bhosale, A. Narale, D. Raut, M. Bamankar, G. Kathwate, P. Chaudhari, A. Chavan, R. Pinjari and A. Lawand, J. Mol. Struct., 2023, 1294, 136492 CrossRef CAS .
- T. M. Kavya, L. V. Menon, K. K. M. Hashim and E. Manoj, J. Mol. Struct., 2024, 1295, 136802 CrossRef CAS .
- Y. El Bakri, M. M. Kurbanova, S. A. Siddique, S. Ahmad and S. Goumri-Said, Arab. J. Chem., 2022, 15, 104230 CrossRef CAS PubMed .
- Y. El Bakri, M. Kurbanova, S. A. Siddique, S. Karthikeyan, A. Maharramov and N. Ramazanzade, J. Mol. Struct., 2023, 135623 CrossRef .
- A. J. Edwards, C. F. Mackenzie, P. R. Spackman, D. Jayatilaka and M. A. Spackman, Faraday Discuss., 2017, 203, 93–112 RSC .
- W. Humphrey, A. Dalke and K. Schulten, J. Mol. Graph., 1996, 14, 33–38 CrossRef CAS PubMed .
- T. Lu and F. Chen, J. Comput. Chem., 2012, 33, 580–592 CrossRef CAS PubMed .
- A. D. Steffy, D. A. Dhas, I. H. Joe and S. Balachandran, J. Mol. Struct., 2024, 1295, 136653 CrossRef CAS .
- M. A. Albo Hay Allah, A. A. Balakit, H. I. Salman, A. A. Abdulridha and Y. Sert, J. Adhes. Sci. Technol., 2023, 37, 525–547 CrossRef CAS .
- A. A. Abdulridha, M. A. A. H. Allah, S. Q. Makki, Y. Sert, H. E. Salman and A. A. Balakit, J. Mol. Liq., 2020, 315, 113690 CrossRef CAS .
- Y. El Bakri, S. K. Mohamed, A. Ahsin, S. Karthikeyan, S. Abuelhassan, A. E. Abdel-Rahman, I. S. Marae, E. A. Bakhite, J. T. Mague and R. Al-Salahi, Arab. J. Chem., 2023, 16, 105294 CrossRef CAS .
- E. I. Edache, A. Uzairu, P. A. Mamza, G. A. Shallangwa and M. T. Ibrahim, J. Umm Al-Qura Univ. Appl. Sci., 2024, 1–19 Search PubMed .
- J. Liu, Z. Chen and S.-F. Yuan, J. Zhejiang Univ. B, 2005, 6, 584–589 CrossRef PubMed .
- K. C. S. Achar, K. M. Hosamani and H. R. Seetharamareddy, Eur. J. Med. Chem., 2010, 45, 2048–2054 CrossRef CAS PubMed .
- K. Karrouchi, S. A. Brandán, Y. Sert, H. El-Marzouqi, S. Radi, M. Ferbinteanu, M. E. A. Faouzi and Y. Garcia, J. Mol. Struct., 2020, 1219, 128541 CrossRef CAS .
- E. D. Glendening, C. R. Landis and F. Weinhold, J. Comput. Chem., 2013, 34, 1429–1437 CrossRef CAS PubMed .
- P. A. Channar, A. Saeed, M. F. Erben, F. A. Larik, S. Riaz, U. Flörke and M. Arshad, J. Mol. Struct., 2019, 1191, 152–157 CrossRef CAS .
- M. Azman, A. H. Sabri, Q. K. Anjani, M. F. Mustaffa and K. A. Hamid, Pharmaceuticals, 2022, 15, 975 CrossRef CAS PubMed .
- W. M. Pardridge, J. Cereb. Blood Flow Metab., 2012, 32, 1959–1972 CrossRef CAS PubMed .
-
J. Vrbanac and R. Slauter, A comprehensive guide to toxicology in nonclinical drug development, Elsevier, 2017, pp. 39–67 Search PubMed .
- S. Scheler, A. Fahr and X. Liu, ADMET DMPK, 2014, 2, 199–220 Search PubMed .
- S. Tyagi, P. Gupta, A. S. Saini, C. Kaushal and S. Sharma, J. Adv. Pharm. Technol. Res., 2011, 2, 236–240 CrossRef CAS PubMed .
- J. Strickland, A. J. Clippinger, J. Brown, D. Allen, A. Jacobs, J. Matheson, A. Lowit, E. N. Reinke, M. S. Johnson and M. J. Quinn Jr, Regul. Toxicol. Pharmacol., 2018, 94, 183–196 CrossRef PubMed .
- G. R. Bickerton, G. V. Paolini, J. Besnard, S. Muresan and A. L. Hopkins, Nat. Chem., 2012, 4, 90–98 CrossRef CAS PubMed .
- I. Ahmad, A. E. Kuznetsov, A. S. Pirzada, K. F. Alsharif, M. Daglia and H. Khan, Front. Chem., 2023, 11, 1145974 CrossRef CAS PubMed .
- R. B. Van Breemen and Y. Li, Expert Opin. Drug Metab. Toxicol., 2005, 1, 175–185 CrossRef CAS PubMed .
- F. M. Capellini, W. Vencia, M. Amadori, G. Mignone, E. Parisi, L. Masiello, B. Vivaldi, A. Ferrari and E. Razzuoli, Cytotechnology, 2020, 72, 97–109 CrossRef CAS PubMed .
-
A. K. Shakya, B. O. Al-Najjar, P. K. Deb, R. R. Naik and R. K. Tekade, Dosage Form Design Considerations, Elsevier, 2018, pp. 259–286 Search PubMed .
-
S. E. Wolverton and J. J. Wu, Comprehensive dermatologic drug therapy, Elsevier Health Sciences, 2019 Search PubMed .
-
S. Padmanabhan, Handbook of pharmacogenomics and stratified medicine, Academic Press, 2014 Search PubMed .
- L. Bertilsson, M. Dahl, P. Dalén and A. Al-Shurbaji, Br. J. Clin. Pharmacol., 2002, 53, 111–122 CrossRef CAS PubMed .
- S. Khair-ul-Bariyah, M. Sarfraz, A. Sharif, Z. H. Farooqi, M. Arshad, E. Ahmed, M. Ashraf, S. Abdullah, M. N. Arshad and A. Waseem, J. Mol. Struct., 2024, 1299, 137118 CrossRef CAS .
- A. Garrido, A. Lepailleur, S. M. Mignani, P. Dallemagne and C. Rochais, Eur. J. Med. Chem., 2020, 195, 112290 CrossRef CAS PubMed .
-
T. A. Berger, B. K. Berger and K. Kogelman, 10.18 - Chromatographic Separations and Analysis: Supercritical Fluid Chromatography for Chiral Analysis and Semi-Preparative Purification, in Comprehensive Chirality, ed. J. Cossy, Elsevier, 2nd edn, 2024, pp. 355–393 Search PubMed .
- M. Ayyaz, M. Sarfraz, M. Arshad, A. Yaqoob, S. A. Siddique, S. Hussain, M. A. Ali, A. M. Qureshi and A. Rauf, J. Mol. Struct., 2024, 1299, 137153 CrossRef CAS .
- S. Saikia and M. Bordoloi, Curr. Drug Targets, 2019, 20, 501–521 CrossRef CAS PubMed .
- M. Sarfraz, A. Rauf, P. Keller and A. M. Qureshi, Can. J. Chem., 2021, 99, 330–345 CrossRef CAS .
- M. T. Muhammed and E. Aki-Yalcin, Lett. Drug Des. Discovery, 2024, 21, 480–495 CrossRef CAS .
- K. Ahmed, M. Bashir, R. Bano, M. Sarfraz, H. U. Khan, S. Khan, A. Sharif, A. Waseem, M. A. Gilani and K. Batool, J. Mol. Struct., 2023, 1284, 135383 CrossRef CAS .
- Y. El Bakri, M. Kurbanova, A. Ahsin, S. Karthikeyan, A. Maharramov, R. Al-Salahi, S. Kansız, S. N. Mali and M. Ashfaq, Chem. Phys. Impact, 2024, 8, 100477 CrossRef .
- C. Gutierrez and R. Schiff, Arch. Pathol. Lab. Med., 2011, 135, 55–62 CrossRef PubMed .
- N. Iqbal and N. Iqbal, Mol. Biol. Int., 2014, 852748 Search PubMed .
- C. Yewale, D. Baradia, I. Vhora, S. Patil and A. Misra, Biomaterials, 2013, 34, 8690–8707 CrossRef CAS PubMed .
- J. Wykosky, T. Fenton, F. Furnari and W. K. Cavenee, Chin. J. Cancer, 2011, 30, 5 CrossRef CAS PubMed .
- A. S. Kawale and L. F. Povirk, Nucleic Acids Res., 2018, 46, 520–537 CrossRef CAS PubMed .
Footnote |
| † Electronic supplementary information (ESI) available. CCDC 2349822 and 2349823 contain the supplementary crystallographic data for the obtained compounds 2 and 3 respectively. For ESI and crystallographic data in CIF or other electronic format see DOI: https://doi.org/10.1039/d4nj01839g |
|
| This journal is © The Royal Society of Chemistry and the Centre National de la Recherche Scientifique 2024 |

 *a,
Sabir Ali
Siddique
*a,
Sabir Ali
Siddique