
Kryptoracemic compound hunting and frequency in the Cambridge Structural Database†
Simon
Clevers
 * and
Gérard
Coquerel
* and
Gérard
Coquerel
Normandie Université, Laboratoire SMS-EA3233, Université de Rouen Normandie, F76821, Mont Saint Aignan, France. E-mail: simon.clevers1@univ-rouen.fr
First published on 18th June 2020
Abstract
Kryptoracemic compounds (KRCs) are a rare case of racemic pairs of antipodes crystallizing in Sohncke (chiral) space groups. In order to identify KRCs in the Cambridge Crystallographic Structural Database (CSD), a Python script named ChiPi was written to automatically assign the chirality of each crystal structure. The ChiPi code is able to compare each residue contained in a crystal structure based on the chiral centres that were identified and allows discrimination between enantiomeric, diastereomeric, racemic, meso and scalemic structures. It was used to process 393![[thin space (1/6-em)]](https://www.rsc.org/images/entities/char_2009.gif) 012 organic entries from the CSD corresponding to almost the entire set of organic crystal structures. It is estimated that racemic compounds constitute 23.8% and 22.2% of centrosymmetric and achiral non-centrosymmetric organic structures in the CSD, respectively. The KRCs represent 0.2% of the whole database and 0.8% of the chiral space groups. The KRC occurrence represents circa 1% (724 structures) of the set of racemic compounds. The distribution of the KRC space groups is drastically shifted toward lower symmetry space groups with a large prevalence of P21 structures. This trend is not restricted to KRCs only but can be extended to structures containing chiral molecules with an even Z′ number.
012 organic entries from the CSD corresponding to almost the entire set of organic crystal structures. It is estimated that racemic compounds constitute 23.8% and 22.2% of centrosymmetric and achiral non-centrosymmetric organic structures in the CSD, respectively. The KRCs represent 0.2% of the whole database and 0.8% of the chiral space groups. The KRC occurrence represents circa 1% (724 structures) of the set of racemic compounds. The distribution of the KRC space groups is drastically shifted toward lower symmetry space groups with a large prevalence of P21 structures. This trend is not restricted to KRCs only but can be extended to structures containing chiral molecules with an even Z′ number.
Introduction
After crystallization of a racemic solution, three main cases of phase equilibria can exist between non-racemizable enantiomers in the solid state: (i) racemic compound systems (90–95% of the cases) where the crystal contains two enantiomers in equal amounts, (ii) conglomerate systems (i.e. a complete chiral discrimination in the solid state, 5–10% of the cases) where both enantiomers crystallize in separate enantiopure particles and (iii) solid solution (1–2%).1–5 These possibilities for the crystallization of racemic mixtures from solution together with the space group frequencies of crystals obtained in each case are summarized in Table 1. In conglomerate systems, each enantiomer must necessarily crystallize in one of the 65 non-centrosymmetric chiral space groups (hereafter Sohncke SGs) that do not have any inversion symmetries (the presence of these symmetry elements will generate the opposite enantiomer in the crystal structure and is thus not compatible with a single enantiomer in every particle). The frequency of spontaneous resolution is difficult to estimate because, in most cases, there is no indication in the literature telling whether an enantiopure crystal represents a conglomerate or was crystallized from an enantiopure overall composition. There is no space group (SG) restriction for solid solution or racemic compounds. Three different cases are thus possible for the crystallization of a racemic compound and statistics reveal that the majority crystallize in (i) centrosymmetric SGs, (ii) in achiral non-centrosymmetric SGs, and (iii) in Sohncke SGs. The last case is reported as “kryptoracemate” or “false conglomerate”.6,7 In this work we will use the term kryptoracemic compounds (KRCs). The number of independent molecules in the asymmetric unit Z′ is greater than 1. In a KRC stricto sensu, Z′ should take an even value (to respect the racemic composition). One can extend this definition to an odd number of Z′: in this case, the composition necessarily deviates from racemic to scalemic (e.g. 2 S enantiomers for 1 R enantiomer). These types of scalemic compounds were referred to as “unbalanced compounds” and seem to be much rarer than the purely racemic KRCs.6| Organic crystal structure database (100%) | ||||
|---|---|---|---|---|
| Achiral SGsc (75%) | Chiral SGsc (25%) | |||
| Centrosymmetricc (85.5%) | NCc (15.5%) | Sohncke SGs (100%) | ||
|
a “Unbalanced compounds” are not obtained from racemic solutions because they deviate from the 50:50 (R:S) composition. Nevertheless, we include these very rare compounds in an extended definition of kryptoracemic compounds.
b Scalemic compounds are not allowed in centrosymmetric or in NC achiral SGs but we refer here to scalemic AU (i.e. structure having an odd Z′).
c This study.
d These values are strongly biased toward non-Sohncke SGs because of the detection method used.
|
||||
| Racemic compound (90–95%)1 | Structure | Permitted | Permitted | Permitted (KRC) |
| Frequency | 92.75%c | 6.25%c | 1%c | |
| Top SG |
P21/c, C2/c, Pbca, P![[1 with combining macron]](https://www.rsc.org/images/entities/char_0031_0304.gif) |
Pna21, Pca21, Cc | P21, P212121 | |
| Conglomerate (5–10%)1 | Structure | Forbidden | Forbidden | Permitted |
| Frequency | 0% | 0% | 100% | |
| Top SG | — | — | P212121, P21C2, P1 | |
| Solid solution | Structure | Permitted | Permitted | Permitted |
| (1–2%)d | Frequency | 81% (ref. 5) | 7% (ref. 5) | 12% (ref. 5) |
| Top SG |
P21/c, P C2/c, Pbca |
Pna21, Cc, Pca21 | P212121, P21, P1 | |
| Scalemic compounds (unbalanced crystallization)a <1% | Structure | Forbiddenb | Forbiddenb | Permitted |
| Proportion | 228 entriesc | 17 entriesc | 37 entriesc | |
| Top SG |
P, P21/c, C2/c |
Cc, Pna21 | P212121, P21 | |
KRCs are considered to be rare; Fábián and Brock determined a list (manually checked) of 181 KRCs in organic structures.8 Recently, Grothe et al. published a list of 409 probable KRCs (although the list was not verified).9 Bernal and Watkins published a review covering metal–organic compounds with a stereogenic metal atom and determined a list of 26 possible KRCs.10 The proportion was estimated at 0.2% of the organic Cambridge Structural Database (CSD). More recently, Rekis published a list of 313 KRCs in a study based on single-component crystal structures (0.8% of his racemic compound subset).5 For all these surveys, the authors always mentioned the difficulties in performing an exhaustive search for this class of compounds.
In order to detect KRCs from the CSD, a thorough analysis of crystal chirality must be performed over the whole database. As highlighted by previous studies,7,8,10 there is no efficient way for searching racemic crystal structures in the CSD. The main reason is that the CSD does not store information on the stereochemistry of the entries. The only information about the chirality of a component can be found in the name, if the “rac”, RS, R or S label is indicated, but these data cannot be reasonably used to try to assign the chirality of every entry. Attempts to classify the chirality of crystal structures were already performed.
In 2000, the CSD contained 77986 unique organic structures (64.5% were non-centrosymmetric and 35.5% were centrosymmetric). From these data, Dalhus et al. selected 9817 structures assuming that the distribution was the same in the whole database and they manually determined the chirality for each structure. One can notice that this subset contained 7% crystal structure redeterminations (i.e. duplicates: crystal structures of the same compound but resolved several times). They estimated that the frequency of centrosymmetric racemates was 23% in centrosymmetric structures. Nowadays, the strategy employed by Dalhus et al. could hardly be applied.11 The exponentially growing crystallographic data (more than 1 million crystal structures in the CSD in 2020) necessitate the development of tools able to automatically assign the chirality of crystals. Probably the most complete statistical survey of organic crystals on stereoisomerism in the CSD was performed by Grothe et al.9 They analyzed 254354 entries and their main conclusions are summarized in Table 2. Unfortunately, their computer code is not freely available for the scientific community. To our knowledge, the only software serving to perform batch assignment of chirality on a large number of structures and that is freely available is ChiralFinder developed by Eppel et al. ChiralFinder12 can sort out a list of structures according to the chirality of crystals (achiral, meso, racemic, chiral). Nevertheless, this software required the export of the structures from Conquest and, unfortunately, large numbers of structures are not treated (circa 7%) especially when disorder is involved in the packing. The flexibility of the software is also limited because we cannot directly extract other crystal data such as SG, R-factor, density, cell parameters, etc. that could be of relevance for a statistical survey.
| Ref. | N | % chiral structures in | % racemic structures in | % achiral structures in | ||||||||
|---|---|---|---|---|---|---|---|---|---|---|---|---|
| NC | S | CSD | NC | S (KRC) | C | CSD | NC | S | C | CSD | ||
| a No attempt was made to estimate this proportion. b This study. c Solvates, salts and co-crystal were excluded. | ||||||||||||
| 11 | 9379 | — | — | 2.3 | 0.07a | 23 | 15.6 | — | — | — | — | |
| 27 | 34946 b |
82 | 82 | 17 | — | — | 35 | 24 | 18 | 18 | 65 | 50 |
| 28 | 100864 |
— | — | 25 | — | — | — | 18 | — | — | — | 57 |
| 8 | 174465 |
— | — | — | — | 0.4 | — | — | — | — | — | — |
| 9 | 254354 |
— | — | — | — | 0.4 | — | — | — | — | — | — |
| 5 | 178924 |
— | 81c | 22c | — | 0.6c | — | 23c | — | 19c | — | 54c |
| ChiralFinderb12 | 393004 |
62 | 75 | 18 | 4 | 0.6 | 22 | 17 | 30 | 20 | 70 | 56 |
| ChiPib | 393012 |
64 | 78 | 19 | 4 | 0.8 | 24 | 18.6 | 30 | 20 | 73 | 62 |
The main motivation for this publication is to access the chirality of organic crystals in order to assess the frequency of racemic compounds (RCs) and chiral crystals over different space groups in the Cambridge Structural Database. For that purpose, we developed a Python script named ChiPi and entirely based the script on CCDC Python API.‡ The simplicity is that we only need a refcode list to start the determination of crystal chirality. The program could easily be modified to directly work in CSD subsets without exporting files from Conquest. The program is based on functions provided by CCDC API Python solution (v 2.3.0). All functions are used in standard mode without modifying standard parameters. The ChiPi source code is also freely available in the ESI† (ChiPi.py).
Out of the 393012 entries analyzed, ChiPi found 191936 chiral residues for 160201 chiral chemicals representing 668152 assignments of chiral centers. The carbon atom represents 98.3% (657040 atoms) of these 668152 stereocenters. The numbers of R and S atoms are almost identical with 50.59% (337999 hits) and 49.41% (330153 hits), respectively. The proportion of chiral atoms having hydrogen atoms as one of the four constituents represents 79.3% (530149 hits) of the stereogenic centers (80.7% of the chiral carbon atoms). The missing hydrogen atoms in the crystallographic data are thus of particular importance in the determination of the stereocenter chirality. It was estimated that 5.7% of crystal structures having at least one molecular residue with stereocenters having a hydrogen atom as one of its four substituents are concerned by this problem of missing hydrogen atoms. It represents at most 9% of the stereocenters detected by ChiPi. In the following, we use ChiPi script to investigate the frequency of racemic compounds (RCs) in the CSD focusing our study on the detection of KRCs.
Determination of subsets
ConQuest 2.03 (Build 257310)13 was used to search the CSD 5.41 database. The refcode list of our subset was exported as well as the coordinate files in coord and gcd format. The different subset analyses were extracted from the CSD database in gcd file format, using Conquest with the following restrictions: 3D coordinates determined, no errors, not polymeric, only organics. Crystal structure determination from powder was allowed. This represented 415167 entries. Each entry in the CSD is referenced by a refcode that is a series of 6 letters. With time, an entry in CSD can have several structure redeterminations (duplicates) that are indicated by a number just after the refcode. These duplicates contain different data collections (at different temperatures and/or pressures or determined by different research groups). They also account for polymorphs of the same compound. The number of duplicates can create bias in a statistical survey; although for most of the structures the number of redeterminations is non-existent, for certain compounds or series of compounds this number is not acceptable. For instance, the well-known glycine (GLYCIN) has 100 crystal structure redeterminations in the CSD (v5.41)! In addition, the CSD database keeps all structures, even those that have been “Marshed”14–24 and that could create a statistical bias in particular on account of polymorphism, because a Marshed structure often coincided with a space group change. In this work, duplicate structures were filtered, keeping those with the lowest R-factor and with different space group settings and Z′ values. However, this method could remove from this data set polymorphs having the same space group and Z′. Furthermore, our data set was split into non-disordered (ND) and disordered (D) structures and the above procedure will keep duplicate structures if a molecule possesses a structure in both subsets. Out of the 415167 structures, 22155 duplicates (5.3% of the CSD) were found. For instance, the number of duplicates was reduced to 7 for glycine. The distribution of duplicates in different subsets is summarized in the ESI† (ESI-1). This distribution is relatively homogeneous in the whole CSD and, interestingly, one can notice that it does not change the statistics of distribution of the different subsets after filtering. This means that the number of redeterminations in each subset is proportionally similar.
Determination of the crystal chirality by ChiPi
The ChiPi code was written in Python 2.7.15 and with the version 2.3 of the CCDC Python API. ChiPi can analyze each crystal structure and classify them into the following subsets: (a) achiral if the structure does not contain any chiral molecules; (b) chiral if the structure contains chiral molecules in enantiopure amounts (it must crystallize in Sohncke SGs); (c) racemic if the structure contains enantiomers in racemic amounts; (d) meso if the structure contains non-optically active stereoisomers, which means that the molecule is not chiral (despite containing an even number of stereogenic centers); (e) diast if the structure contains at least a couple of diastereomers, (f) scalemic if the structure contains enantiomers in scalemic proportion, (g) KRC if the structure contains enantiomers in racemic proportion and crystallized in Sohncke SGs. Explanations of the general procedure used by ChiPi to determine the chirality of each crystal are available in the ESI† (ESI-3 with an example in ESI-5) as well as results obtained for the organic teaching subset of the CSD (Teaching_results.xlsx). If a problem occurs during this determination, the structure is discarded. Generally, circa 3% (10165) of the structures were removed from the data set because of (i) a problem during the assignment of bond types and/or missing hydrogen atoms (7126 structures) and (ii) the presence of “mixed chiral” atoms (3039 structures). Two different notions must not be confused in the following: (i) the chirality of the asymmetric unit (AU) that represents the relation between the molecules in the AU and (ii) the chirality of the structure that represents the relation between molecules in the unit cell. For instance, a centrosymmetric crystal can be racemic with a chiral AU that contains two molecules of the same enantiomer (Z′ = 2).
Comparison with other programs and estimation of the errors
ChiPi results were essentially compared to examples given by Grothe et al. and to results obtained using the program ChiralFinder developed by Eppel et al. As mentioned by Grothe et al., most of the programs have problems in determining the chirality of the asymmetric center in molecules with interconnected rings. Their program detects, for instance, five chiral centers in the CSD entry GIGSOE, while only one is detected by Mercury (Fig. 1a) or by PLATON.25 Nevertheless, the reason does not lie in a problem of calculation but more in the quality of the crystallographic data. Indeed, checking “3D coordinates determined” in Conquest does not ensure the completeness of the crystal structure. In most cases, the hydrogen atoms are missing. Therefore, Mercury26 does not correctly access the chirality of the molecule because the carbon atom is only connected to three neighbors. Hopefully, the “auto-edit structure” capability provided by Mercury can assign “unknown” bond types and missing hydrogen atoms. After completion of the structure, both PLATON and Mercury are able to correctly detect and assign atom chirality for this structure (see Fig. 1b).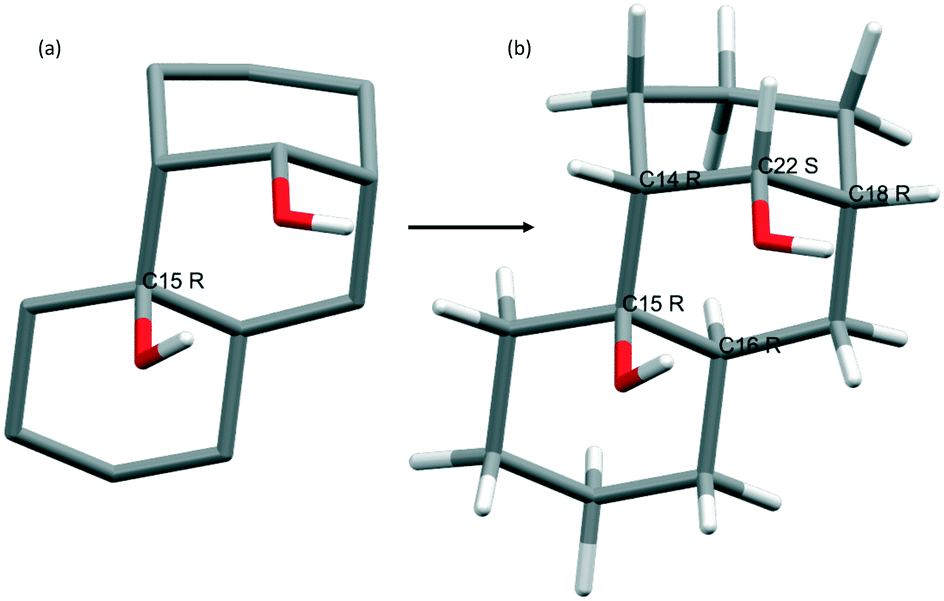 | ||
| Fig. 1 Molecule in GIGSOE before the “auto-edit structure” feature of Mercury where only 1 chiral atom is detected (a) and after the edit (symbolized by a black arrow) where 5 chiral atoms are detected (b). It highlights the importance of the completeness of crystallographic data especially for the presence of hydrogen in the determination of the chirality by a computer algorithm. | ||
We assume that, in most of the cases, the automatic assignment of missing hydrogens, that corresponds to step 2 of the ChiPi script, is correct (if a problem occurs in any steps of this procedure the structure is not treated, see ESI-3†). Contrary to the algorithm developed by Grothe et al., ChiPi is able to treat structures with stereogenic centers located in the same ring.
To compare our results on a large data set, we used another program named ChiralFinder (CF)12 that accepts data from the CSD (in coord format) and returns gcd lists of achiral, chiral, racemic, meso and error structures (hereafter “not-treated”). The main results obtained both with CF and ChiPi are summarized in the ESI† (ESI-2). Globally, the results between both scripts are similar but in certain cases the differences are important especially for disordered structures (e.g. achiral structure). One can notice that the number of untreated structures by ChiralFinder is sometimes important, reaching circa 30% of certain subsets. It could explain the differences between both algorithms. Out of the 393012 structures the total number of non-treated entries by ChiralFinder and ChiPi is 7% and 3%, respectively.
Errors in the determination of the chirality also depend on the type of atom: by analyzing the classification of different structures, it seems that some of the boron or phosphorus atoms were potentially more often detected as achiral by ChiPi (although it was difficult to estimate a number), while Mercury correctly assigned this atom to be chiral centers. This bias (or bug in Python API) will necessitate further developments but should not drastically change the statistics of this study. In the following, we assume that the non-treated structures have the same distribution in different crystal classes (a favorable indicator is that the SG ranking of the non-treated structures is the same as that for the whole CSD). The estimation of the error by comparison with other studies is not trivial because the subset and the restrictions on the analyzed structures often differ. One can try to determine it by comparing results obtained on known structures. For instance, concerning KRCs, Grothe et al. published a list of 409 structures although this list needed to be carefully checked. Among these structures, ChiPi detects 98% of these structures as KRC structures; two of them are assigned to be racemic (actually, ChiPi detected non-Sohncke space groups), one was identified as a meso and one was not treated (problem in the coordinates). Therefore, ChiPi was able to detect and correctly assign 99% of the KRCs of this list (discarding the two racemic structures).
Out of the list published by Fábián et al. (247 structures including the 181 confirmed structures), 232 structures (94%) are assigned to be KRCs. The others are detected as chiral (VEYBEH that could be in fact a solid solution or a scalemic compound and PEMWOU that is a cis/trans enantiomer), 1 meso (NAHZAX), 1 diast, 4 not-treated (because of the presence of “mixed” chiral atoms or problems in the determination of the chirality). For comparison, in the list of Grothe et al., 64 structures belonging to the list of Fábián et al. are missing. These differences essentially lie in the way of detection of the chiral atom and the chosen subset.
Even if the similarity between ChiPi and these two lists is good, it does not really assess the error of misassignment on the detected KRC structures in the whole CSD. The main limitation of the ChiPi program is probably the detection of meso structures that represent the main source of missed assignments. Grothe et al. published a list of possible mesoisomer structures (5697 entries). Among them 92% (5224 entries) crystallize in non-Sohncke SGs and 8% (474 entries) in Sohncke SGs. Assuming that all structures of this list are effectively meso, ChiPi is only able to detect 61.7% of the structures as possible meso structures. The others are assigned to racemic (28.6%), chiral (3.1%), achiral (2.8%), scalemic (0.04%), and diast (0.02%), and 3.62% were not treated principally due to the presence of “mixed” chiral atoms in the structures. The detection of meso compounds is almost entirely based on the determination of the molecular point-group. Unfortunately, the algorithm used by CCCD python API seems to have some difficulties for a number of molecules. For instance, the molecule in the AVAYIF structure is not detected in Cs point group while other algorithms such as SYMMOL (included in PLATON) correctly assign the point group. This lies in the algorithm used that does not allow a change in the distance or angle tolerances. As discussed with the CCDC staff, this should be implemented in further versions of Python API. Maybe, implementation of new algorithms of molecular point group calculations (such as SYVA29 or SYMMOL30) could also be helpful.
Based on these results and past statistics, we can roughly estimate the error at 2% for KRC detection in the CSD although there is no easy way to estimate non-detected structures (due to wrong assignment of chirality, for example). Additionally, the Marshed structures that particularly concern Sohncke SGs can also generate circa 2% of wrong structures. Finally, the error on KRCs assignment is thus estimated at 4%. The other error estimations for different classes are summarized in Table 3. Grothe et al. estimate the proportion of meso compounds to be 2.2% of the CSD. We found 1.9%. Accounting for the error on the detection of meso compounds by ChiPi, the proportion of meso structures is probably closer to 2.5% in the CSD.
Results and discussion
Racemic and kryptoracemic compounds (KRCs) in CSD
Out of the 392012 analyzed structures by ChiPi, 748 are classified as KRCs. Rapid check of the newest KRC structures revealed that 16 are in fact meso compounds that represent an error of circa 2%. In addition, 21 structures have been Marshed and consequently were discarded. It means that errors in KRC detection are circa 5% (a majority of them being Marshed structures), slightly above the estimated error of 4%. One can also notice that 66 structures (including Marshed structures) belong to the “doubtful list” of Fábián et al. Out of these structures, 49 were not at first rejected; until further redetermination and collection of better crystallographic data, there is no obvious reason to discard them.
The final list of KRCs is obtained after merging the two known previous lists of kryptoracemates and leads to 724 structures (refcodes in the ESI†). It represents circa 0.18% of the CSD, 0.75% of the Sohncke SGs and circa 1% of the racemic compounds. The frequencies of KRCs in the entire CSD subset and different subsets are given in Table 4. It seems that the frequency of KRCs is slightly higher in disordered structures (1%) compared to non-disordered (0.6%) and that ionic associations have no influence on the formation of KRCs. Nonetheless, the majority (70%) of KRCs crystallize in non-disordered non-ionic structures. It is worth mentioning that some of the detected KRCs could be solid solutions. According to Rekis5 this part is estimated to be 14 structures (2% of the KRCs). The proportion of racemic compounds in achiral and chiral and the predominant SG are given in Table 1.
| Structure type | Sohncke SG (%) | KRC (%) | KRC entries |
|---|---|---|---|
| Disordered and ionic | 72.7 | 1 | 31 |
| Disordered and non-ionic | 82.6 | 0.9 | 122 |
| Non-disordered and ionic | 76.4 | 0.6 | 68 |
| Non-disordered and non-ionic | 83.9 | 0.6 | 503 |
| Sohncke SG | 100 | 0.75 | 724 |
| CSD (organics) | 24.5 | 0.18 | 724 |
Each structure of this list is tested for additional symmetry with PLATON (ADDSYM) in batch mode. KRC candidates are classified into two main groups:
(i) A class with no alert in PLATON (565 structures).
(ii) B class in which PLATON ADDSYM alerts occur (159 structures, for a maximum non-fit of 20%).
Among the B class, ADDSYM Exact calculations were performed in PLATON (i.e. for a maximum non-fit of 0% with non-metric tolerance), only 64 structures still have a PLATON alert. Although a PLATON alert does not necessary mean that the structure is uncorrected (the opposite is not true), these 159 structures are discarded and classified as ambiguous. One can notice that among the B class, 46% of the structures are P21 and 40% are P1. The main change proposed by PLATON is an addition of a center of inversion transforming a KRC into a regular RC. The missing symmetry and the consequence on the space group change for the B class are summarized in the ESI† (Platon_Alert.xlsx).
For 28 (5%) structures of the A class, a local/non-crystallographic inversion center is detected by PLATON; 110 (20%) have disorder in the structure although the disorder not necessarily imply the stereogenic centers.
Comparison of chiral molecule conformations in single-component crystal structures with Z′ = 2
ChiPi can calculate pairwise molecular overlays as an indicator of conformational differences between pairs of the same enantiomers or a couple of antipodes in crystal structures. The root-mean-square deviation (rmsd) comparison can be viewed as an indicator of conformational differences. A low value means that the molecular conformations are close for both molecules while a high value should highlight the conformational differences. An example of the operation performed by ChiPi is plotted in Fig. 2. The general procedure is described in the ESI† (ESI-4). The conformational comparison is performed for molecules crystallizing as pure components (without any other molecules as coformers or solvent molecules) and Z′ = 2. With this restriction there are 359 KRCs, 871 non-centrosymmetric RCs, 7000 centrosymmetric RCs and 8365 chiral structures. The results of rmsd comparison for each pair of enantiomers in these structures are summarized in Table 5 through five main indicators: the mean value, the standard deviation (std); the median value, the 10th percentile (P10, i.e. 10% of the structures have a lower rmsd value than P10) and the 90th percentile (P90, i.e. 10% of the structures have a higher rmsd value than P90).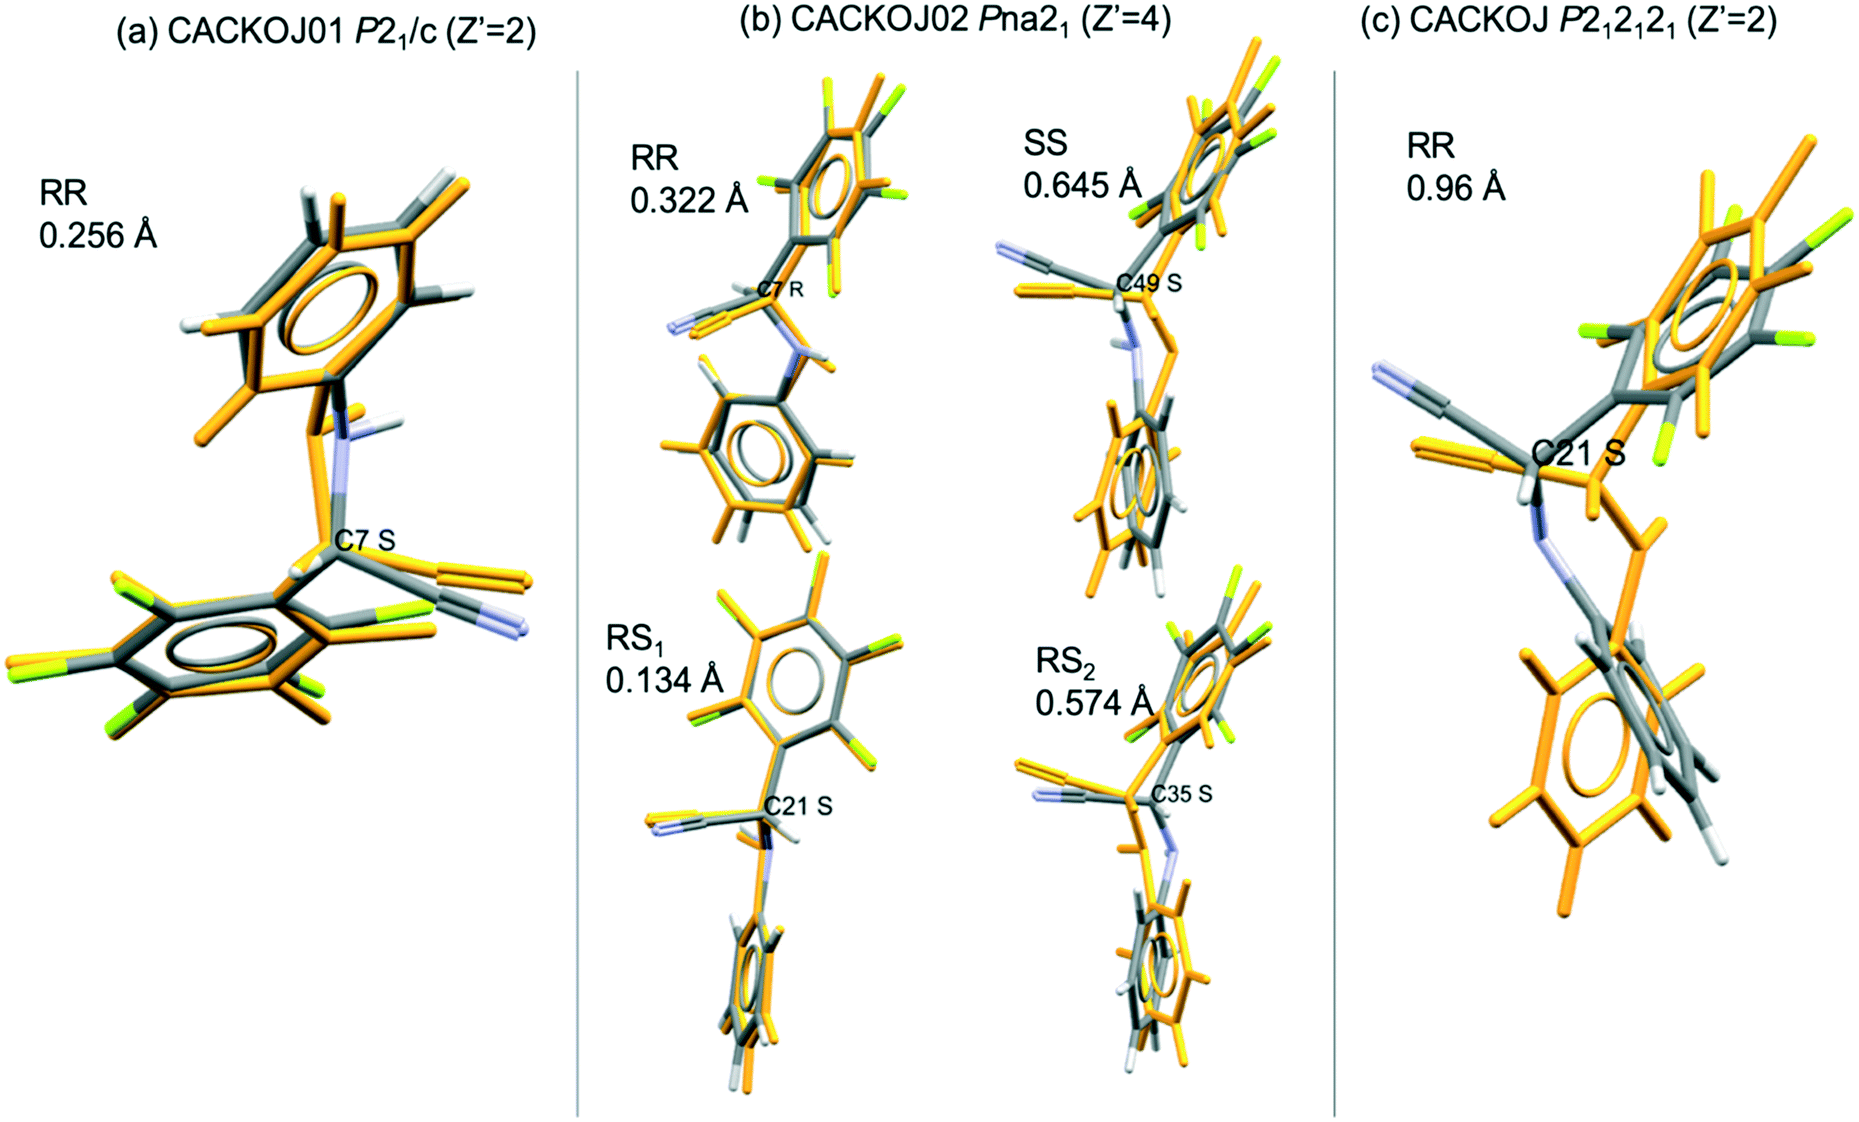 | ||
| Fig. 2 Overlay comparison after inversion for two antipodes in the AU of the CACKOJ01 structure; rmsd = 0.256 Å (a); overlays in CACKOJ02 (only four of the six comparisons are shown) (b) and in CACKOJ (Z′ = 2) (c). | ||
| Non-centrosymmetric | Centrosymmetric | |||
|---|---|---|---|---|
| Class | Kryptoracemic (A class) | Racemic (achiral SG) | Chiral | Racemic |
| N | 359 | 871 | 8365 | 7000 |
| Mean | 0.29 | 0.21 | 0.5 | 0.32 |
| Std | 0.33 | 0.27 | 0.52 | 0.37 |
| Median | 0.16 | 0.10 | 0.34 | 0.19 |
| P10 | 0.04 | 0.03 | 0.07 | 0.05 |
| P90 | 0.77 | 0.51 | 1.14 | 0.78 |
Previous determination of rmsd comparison for enantiomeric pairs in NC crystal structures (not necessarily kryptoracemic) was performed by Dalhus and Görbitz11 and they found an average deviation of 0.19 Å.
Fábián et al. found a similar value of 0.25 Å for the 181 kryptoracemates in their final list and a median value of 0.14 Å. We found very similar values for the 359 KRCs, with Z′ = 2 with an average rmsd of 0.29 Å and median value of 0.16 Å. In most cases, the conformations of the enantiomers were very similar, with 10% of the KRCs having a rmsd difference as low as 0.04 Å. This is probably due to constraints during the refinement to force both molecules to adopt the same conformation. 10% of KRCs have a rmsd higher than 0.77 Å.
Additionally, the values obtained for KRCs and centrosymmetric RCS are almost the same. For non-centrosymmetric RCs (NC-RCs, i.e. crystallizing in achiral NC SGs), all indicators have lower values compared to other RCs with, for instance, a median and P90 rmsd values of 0.10 Å and 0.51 Å, respectively, compared to 0.19 Å and 0.78 Å for centrosymmetric RCs. Therefore, the difference in molecular conformation between antipodes seems to be lower for antipodes in achiral NC-RCs.
One can also notice that the difference of molecular conformation between overlays of the same enantiomer is more important for chiral structures with a mean rmsd value almost twice higher compared to mean rmsd values of NC–RCs, C–RCs or KRCs. The conclusions are the same for other indicators (std, median, P10, P90). We confirm the results of Dalhus et al., who noticed that differences in conformation between two enantiomers are higher in chiral structures than the differences between conformations of a pair of opposite enantiomers in racemic structures (including centrosymmetric, achiral NC and KR structures). This difference could, in part, find an explanation by instabilities induced by the presence of pseudo-symmetry elements or in the constraint differences created during the structure resolution of centrosymmetric and non-centrosymmetric structures (e.g. the presence of an inversion center in the structure will benefit similar conformations between antipodes).31,32
Space group frequency for KRC and RC
Among the NC structures, the SG frequency ranking is P212121, P21; Pna21; P1, C2, Pca21, representing circa 87% of all NC structures. The SG ranking for racemic structures is summarized in Table 6. Among Sohncke structures, the most frequent space group is P212121 (46.6%) followed by P21 (34.5%), P1 (5.3%), C2 (4.9%) and P21212 (2%). We found a completely different distribution of SG for KRCs (A class) with 53.4% in P21, 27.7% in P212121, 11.2% in P1, 2.5% in C2 and 1.8% in P21212. There is a complete inversion of the population between P212121 and P21 crystals although P212121 is circa 35% more abundant than P21 in the entire CSD. The SG frequency for enantiopure chiral structures with Z′ = 1 (47150 entries) is almost identical to that of the entire Sohncke SGs, while for enantiopure chiral structures with Z′ = 2 (8365 hits, i.e. having two enantiopure molecules in the AU) the frequency of SGs changes similarly to the ranking observed for KRCs. All information are summarized in Table 7 together with the SG rankings for enantiopure chiral structure and KRCs with higher Z′.
| Space group (space group number) | Frequency (%) |
|---|---|
| P21/c (14) | 49.2 |
|
P (2) |
28.8 |
| C2/c (15) | 7.1 |
| Pbca (61) | 5.3 |
| Pna21 (33) | 2.1 |
| Cc (9) | 1.4 |
| Pca21 (29) | 1.3 |
| Sohncke SGs | 1 |
| Other | 3.7 |
| Z′ | Sohncke SG | Chiral (enantiopure) for Z′= | KRCs for Z′= | Scalemic | ||||||||
|---|---|---|---|---|---|---|---|---|---|---|---|---|
| All | 1 | 2 | 3 | 4 | 5 | 6 | All | 2 | 4 | 6 | 3 | |
| a The number of enantiopure structures with Z′ = 5 and KRCs with Z′ = 6 are particularly low and could create bias. To have an acceptable number of structures for Z′ >2, statistics are made on the complete list of KRCs (A class + B class; it does not drastically change the KRC statistics trend). The bold formatting is a guideline to spot the most impacted SG frequencies with the Z′ distribution. N is the number of structures for each subset. | ||||||||||||
| P212121 | 46.6% | 55.4% | 22.2% | 41.9% | 8.9% | 45% | 5% | 23.1% | 28.2% | 3% | 0.00% | 35% |
| P21 | 34.5% | 31.5% | 53.1% | 31.9% | 53.5% | 27% | 55% | 51.8% | 52.4% | 52% | 57% | 23% |
| C2 | 4.9% | 4.2% | 5.3% | 6.3% | 4.6% | 14% | 4% | 2.5% | 2.8% | 0.00% | 0.00% | 6% |
| P1 | 5.3% | 1.8% | 14.8% | 8.7% | 29.9% | 14% | 27% | 17.4% | 12.9% | 43% | 43% | 18% |
| P21212 | 2% | 1.7% | 1.6% | 1.9% | 0.3% | 0.00% | 3% | 1.9% | 1.3% | 2% | 0.00% | 6% |
| Other SGs | 6.6% | 5.3% | 3% | 9.1% | 2.7% | 0.00% | 6% | 3.3% | 2.4% | 0.00% | 0.00% | 12% |
| N | 96129 |
47150 |
8365 | 504 | 697 | 22a | 80 | 724 | 451 | 59 | 7a | 20 |
In fact, the winner for the first SG rank seems to be cyclic: (i) for even Z′ the P21 space group is over-represented with a frequency of always around 50% while (ii) for odd Z′ the trend returns to “normal” ranking. In addition, we show in Fig. 3 that P1 seems to be also impacted cyclically with the increase of Z′.
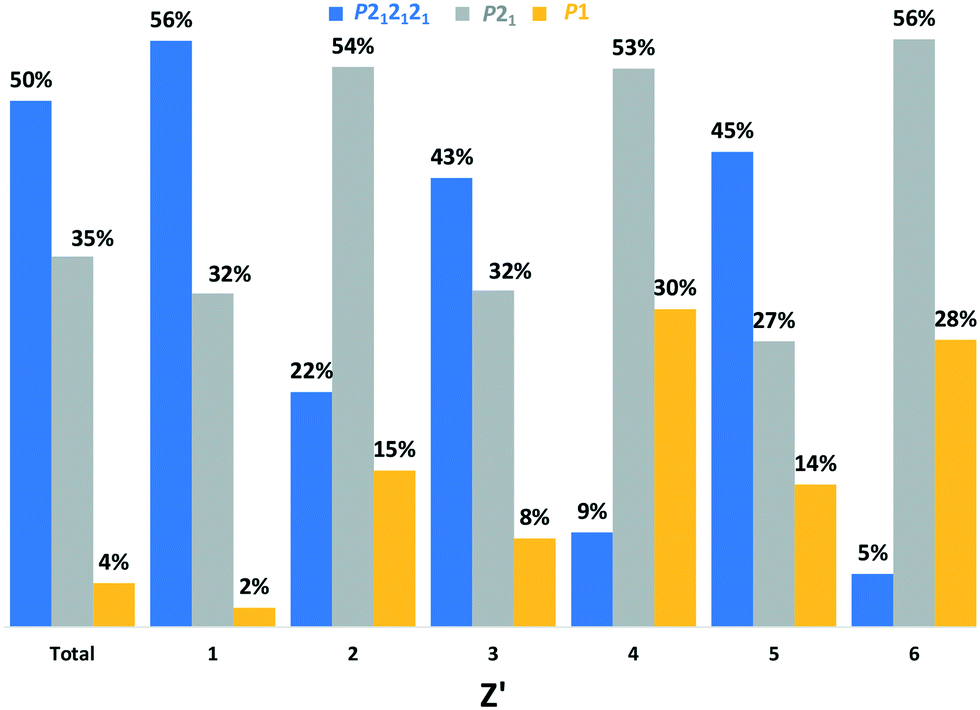 | ||
| Fig. 3 Frequency of P212121, P21 and P1 SG versus Z′ (from 1 to 6) for enantiopure Sohncke crystal structures. | ||
For KRCs, the fraction crystallizing in the P21 space group is also circa 50% for Z′ = 2, 4 and 6. For scalemic or unbalanced compounds (odd Z′), there are only structures with Z′ = 3 if we consider pure compounds. It seems that for this category; the distribution is closer to the global CSD ranking. Therefore, the KRC SG frequencies versus Z′ seem to follow the same trend as for enantiopure chiral structures. We may infer that this SG distribution of structures versus the Z′ is a general trend for structures crystallizing in Sohncke SGs whatever the chirality of the structure (enantiopure, racemic or scalemic). The same study, including structures where achiral molecules crystallize together with an enantiopure proportion of chiral molecules, shows the same trends (statistics made for 1 to 4 chiral molecules in the AU; for more molecules the number entries of structures is too low to make statistics – not shown). Because of the prevalence of Z′ = 1 (almost 50% of the Sohncke subset), the global SG ranking hides this alternation between P212121 and P21 SGs for the first rank. We can also notice that with higher Z′ number (>6) the prevalence of the P1 space group increases progressively to reach 100% that confirms the common observation that a higher Z′ structure crystallizes in a space group of lower symmetry. In Fig. 4, we show that the prevalence of P21 structures over P212121 structures increases only for even Z′ (for odd Z′ the ratio of P21/P212121 remains constant). Observations of abnormal space group frequencies for Z′ >4 have already been reported by Brock.33 She notes that for these structures, P21 is over-represented compared to structures with Z′ <4 (24% versus 9%), and although 40% more frequent than P21 in the CSD, the frequency of P212121 falls drastically. The frequency of KRCs in her subset was also higher than for the whole CSD. This is probably due to the tendency of KRC to crystallize in P21 SG. It is also stated that “if a local/non-crystallographic inversion center (or glide plane) is combined with an n-fold modulation or a hydrogen-bond “n-mer” (n >3), the result is a high Z′ structure”. Therefore, each enantiopure chiral structure (from Z′ = 1 to Z′ = 6) that represents 56738 structures and the KRC structures was analyzed using PLATON to check for a possible missed symmetry and/or the presence of local/non-crystallographic symmetries in routine mode. The comparison of the percentage of both values versus Z′ together with results obtained for KRCs (Z′ = 2, 4 and 6) and scalemic (Z′ = 3) structures are plotted in Fig. 5. In enantiopure chiral structures, the proportion of PLATON alerts and local non-crystallographic inversion (NCI) centers is always statistically higher (circa 10% of the structures having PLATON alerts) for even Z′ compare to odd Z′ numbers (2% of PLATON alerts). For Z′ = 5, this number is null but statistics on this subset could be erroneous because of the low number of structures (22 if we consider only enantiopure compounds, 33 for all structures). For even Z′ chiral structures, in 80% of the alerts, PLATON proposes to add an inversion center. In 20% of the cases PLATON proposes to increase the symmetry of the space group (but remaining in Sohncke structures). In most cases, alerts concern the P21 and P1 space groups with circa 50% and 40% of the alerts, respectively. Interestingly, for P21 alerts and in 20% of the cases it is proposed to change the SG into P212121 and in 70% of the cases to add an inversion center. For P1 structures, 95% of the proposed new SGs possess inversion centers or glide planes. Nevertheless, even if the structures having alerts are discarded from each Z′ subset, the SG ranking is not strongly impacted.
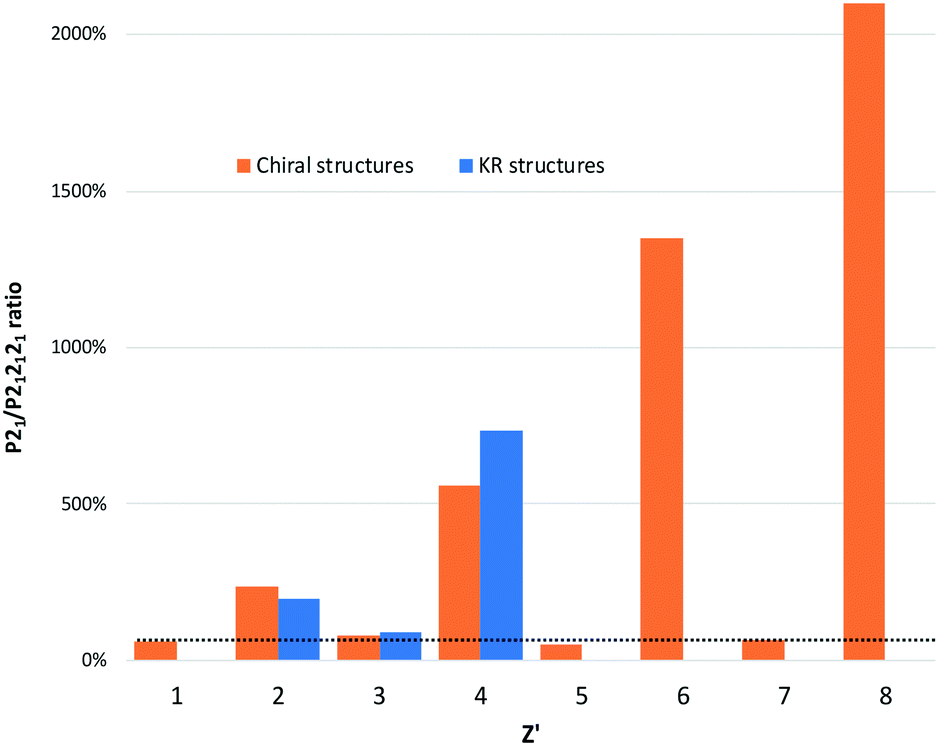 | ||
| Fig. 4
P21/P212121 ratio evolution versus Z′. Statistics made for all the KRCs and chiral structures. The dash line is a guideline showing that the ratio is almost constant for odd Z′. The number of structures for chiral crystals is 51674, 8459, 476, 605, 24, 58, 5 and 22 for Z′ = 1, 2, 3, 4, 5, 6, 7 and 8, respectively. For KRCs (including scalemic compounds), the number of structures for Z′ = 2, 3 and 4 is 588, 19 and 76, respectively. | ||
 | ||
| Fig. 5 Percentage of PLATON ADDSYM alerts and of local/non-crystallographic inversion centers detected in enantiopure crystal for Z′ from 1 to 6, for KRCs (for Z′ = 2, 4, 6) and scalemic structures (Z′ = 3). For enantiopure crystals, the Z′ = 5 subset contains only 22 enantiopure structures; therefore the statistics were made including structures containing achiral molecules that increase the number to 33 structures. The number of KRC structures in the Z′ = 6 subset is too low to draw reliable conclusions. N is the number of structures analyzed in each category. | ||
For the KRC (Z′ = 2, 4 or 6) and scalemic (Z′ = 3) subsets, a similar trend exists between even and odd Z′ (although the number of structures could bias the statistics). PLATON alerts for an even value of Z′ correspond to 21%, 37% and 14% of the structure in each subset for Z′ equal to 2, 4 and 6, respectively. For Z′ = 5, this value falls at 5%. The number of NCI centers is also statistically higher for even Z′ compared to odd Z′. 99% of the PLATON alerts concern the addition of an inversion center or a glide plane. Out of these alerts, 45% concern P21 and 40% concern P1 SGs.
If we compare chiral structures and KRCs (including scalemic structures) with the same Z′ (Z′ = 1 naturally excluded), the number of alerts and NCI centers is always higher in the case of KRCs with 22% alerts and 4.7% NCI centers versus 9% and 1% for enantiopure chiral structures. These high values in KRCs are probably due in part to the structures being assigned to wrong space groups. This behavior seems more pronounced than for chiral enantiopure structures with Z′ >1 having also structures presenting higher values of PLATON alerts compared to Z′ = 1 enantiopure structures (one should recall that PLATON frequency alerts in enantiopure chiral Z′ = 1 is only 0.5% and a NCI center is detected only for 0.1% of the structures).
This alternation of the P21 and P212121 for first rank in KRCs is probably a consequence of wasting inversion centers due to a mismatch between pairwise molecular interactions and possible crystal symmetries.34 The consequence or expression of this frustration could be linked to the prevalence of a lower symmetry space group (P21) compensated for by a higher frequency of non-crystallographic symmetry elements between molecules (Fig. 5). Moreover, it seems easier to relate an even number of molecules by NCIs especially between two antipodes.
This conclusion also applies, while less obviously, for enantiopure compounds (where only one enantiomer is present in the structure). A thorough analysis of these enantiopure crystal structures with an even Z′ could be interesting. These structures exhibiting a higher frequency of local symmetry (compared to odd Z′ enantiopure crystal) could easily accommodate the presence of a counter-enantiomer in the structure and therefore could have a certain propensity to form a solid solution.
The interpretation and the reasons for the existence of high Z′ structures are often discussed in the literature.33,35–38 Some may infer that the reason lies in “bad crystallization” and that the proportion of polymorphs should be higher in these structures compared to Z′ = 1 structures.
Polymorphism in KRCs
The frequency of occurrence of polymorphism in KRCs is estimated at circa 2.6% while it is estimated to be only 1.8% in the whole CSD. Determination of polymorphism in the CSD is not a trivial task because a redetermined structure is not necessarily linked with a polymorph (it could be a Marshed structure, or an erroneous crystal structure or simply a redetermination by other research groups). Moreover, the polymorph information is not always assigned or is assigned even though only one polymorph is referenced in the CSD. For example, the KRC polymorphic information is indicated for 3.6% of the structures and for 2.7% of the whole CSD (excluding KRC structures). In our study, out of the 393012 entries analyzed, the proportion of structure redeterminations linked to polymorphism using the method described in the section “Determination of subsets” is estimated at circa 3.7% of the CSD (14782 entries) for circa 6900 unique refcode families. This leads to a frequency of occurrence of polymorphism estimated at (6900/393012) 1.8% of the CSD (in fact, it is over-estimated since redetermined structures are not necessarily polymorphs and could coincide with disordered/non-disordered structure resolutions). However, this value seems to be in agreement with the literature and can be assessed as a good estimation of the occurrence of polymorphism in our subsets (the frequency of occurrence of polymorphism variables between subsets of the crystal types, solvate, co-crystals, salts…), but it is estimated to be circa 1.2% for single organic components in the CSD).39
In the KRC subset, the number of unique entries having a redetermination is 22 for A class KRCs (for 26 structure redeterminations, i.e. certain entries are at least resolved twice in Sohncke SGs) and 38 for all KRC structures (with 32 unique families) that represents 3.9% (22/565) of A class and 4.4% (32/724) of the KRCs, respectively. Out of these structure redeterminations, 19 are confirmed to really belong to a polymorphic system and are summarized in Table 8. The remaining structures exhibit disorder. Therefore, the occurrence of polymorphism in KRCs is estimated at circa 2.6% (19/724) of the KRC structures. It is statistically higher than the estimated polymorphism in the whole CSD (1.8%). This could be an indication that compounds that could crystallize as KRCs have a higher chance of being polymorphs. Among the 19 polymorphic systems, there are also systems having many polymorphs with 2 (74%), 3 (16%), 4 (5%) and 5 (5%) known polymorphs. In most cases, polymorphism involves a usual racemic centrosymmetric polymorph crystallizing mainly in P or P21/c.
| REFCODE | SG | Z′, Z | Density | PN | Type | |
|---|---|---|---|---|---|---|
| 1 | CACKOJ40 | P212121 | 2, 8 | 1.583 | 4 | II |
| CACKOJ01 | P21/c | 2, 8 | 1.569 | Racemic | ||
| CACKOJ02 | Pna21 | 4, 16 | 1.603 | Racemic NC | ||
| CACKOJ03 | P21/c | 1, 4 | 1.651 | Racemic | ||
| 2 | ONODAY0141 | P21 | 4, 8 | 1.251 | 3 | I |
| ONODAY | P212121 | 2, 8 | 1.202 | I | ||
| ONODAY02 | P21/c | 2, 8 | 1.209 | Racemic | ||
| 3 | QIMBAS42 | P21 | 2, 4 | 1.276 | 2 | III |
| QIMBAS01 | P212121 | 2, 8 | 1.231 | III | ||
| 4 | DLMSUC0143 | P21 | 2, 4 | 1.408 | 3 | I |
| DLMSUC | C2/c | 1, 8 | 1.39 | Racemic | ||
| DLMSUC02 |
P |
2, 4 | 1.421 | Racemic | ||
| 5 | FOHLIY44 | P21 | 2, 4 | 1.17 | 2 | IV |
| FOHLIY01 | Pbc21 | 2, 8 | 1.177 | Racemic NC | ||
| 6 | HISRIL0145 | I2 | 2, 8 | 0.998 | 2 | I |
| HISRI |
P |
2, 1 | 1.037 | Racemic | ||
| 7 | JIZJOR0346 | P21 | 4, 8 | 1.229 | 3 | I |
| JIZJOR0447 | Pc | 4, 8 | 1.229 | Racemic NC | ||
| JIZJOR0247 | Pbca | 1, 8 | 1.249 | Racemic | ||
| 8 | NISMUX0248 | P212121 | 2, 8 | 1.92 | 2 | I |
| NISMUX01 |
P |
2, 4 | 1.898 | Racemic | ||
| 9 | NOLFUP | P21 | 4, 8 | 1.313 | 2 | I |
| NOLFUP01 | P2/c | 1.5, 6 | 1.296 | Racemic | ||
| 10 | PDTOMS1149 | P1 | 2, 2 | 1.149 | 2 | I |
| PDTOMS10 | P21 | 2, 4 | 1.136 | I | ||
| 11 | POWWUW0150 | P21 | 2, 4 | 1.385 | 2 | I |
| POWWUW | P21 | 1, 2 | 1.247 | I | ||
| 12 | QOVREZ0151 | P21 | 2, 4 | 1.463 | 2 | I |
| QOVREZ |
P |
2, 2 | 1.48 | Racemic | ||
| 13 | TETBUS0152 | P21 | 6, 12 | 5 | I – D | |
| TETBUS02 | C2 | 8, 32 | 1.147 | I | ||
| TETBUS | C2/c | 1, 8 | 1.127 | Racemic | ||
| TETBUS03 | P21/c | 1, 4 | 1.099 | Racemic | ||
| TETBUS04 | C2/c | 1, 8 | 1.07 | Racemic – D | ||
| 13 | TOJPOA0153 | P21 | 2, 4 | 1.282 | 2 | III |
| TOJPOA | P212121 | 1, 4 | 1.267 | III-D | ||
| 15 | VUTZIT0154 | P41 | 2, 8 | 1.144 | 2 | I |
| VUTZIT | Cc | 1, 4 | 1.148 | Racemic | ||
| 16 | YIXVAD45 | I2 | 2, 8 | 0.992 | 2 | I |
| YIXVAD01 |
P |
1, 4 | 1.012 | Racemic | ||
| 17 | GENLET0155 | P21 | 4, 8 | 1.316 | 2 | I/ss |
| GENLET |
P |
1, 2 | 1.319 | Racemic | ||
| 18 | IQAREY0156 | P21 | 2, 4 | 1.382 | 2 | I |
| IQAREY | P212121 | 1, 4 | 1.384 | I | ||
| 19 | ZOCPUE57 | P21212 | 2, 8 | 1.219 | 2 | I-D |
| ZOCPUE01 | Iba2 | 1, 8 | 1.193 | Racemic |
Interestingly, the ONODAY system exhibits three polymorphs having Z′ >1 with two KRC structures crystallizing in P21 (Z′ = 4) and in P212121 (Z′ = 2) and one centrosymmetric polymorph in P21/c (Z′ = 2). The rmsd comparisons of each pair of molecules in the AU give a mean value of 0.185 Å for molecule with the same chirality and 0.143 Å for the opposite chirality in the P21 crystal. It is much higher than in P212121 and P polymorphs where the opposite molecules are virtually identical with 0.058 Å and 0.054 Å for rmsd values, respectively. This globally respects the rule asserting that molecular conformations between antipodes are closer than for molecules of the same chirality.
The CACKOJ system is a counter example. In this case, the rmsd value in the P212121 polymorph (Z′ = 2) is 0.96 Å for the overlay of the antipodes, highlighting important conformational differences. The mean values are also relatively high for molecules of the same chirality (0.483 Å) and of the opposite chirality (0.376 Å) in the Pna21 structure (Z′ = 4), while for the P21/c (Z′ = 2) the rmsd value is 0.256 Å. Nevertheless, these values hide disparities of the molecular conformations between different couples of molecules in the Pna21 structures. Indeed, each molecule in the AU exhibits different conformations and the rmsd values for the comparison of R and S molecules are between 0.134 Å and 0.574 Å (see Fig. 2). One can notice that CAKKOJ crystallizes as a centrosymmetric RC, non-centrosymmetric RC and KRC. Every case is specific and the low number of polymorphic systems makes it difficult to spot a clear and significant trend between high Z′ and conformational differences in KRCs.
Comments about the frequency of conglomerates
As previously mentioned, there is no indicator in the CSD to know if an enantiopure structure has been crystallized from racemic solution. Therefore, the frequency of occurrence of spontaneous resolution cannot be determined.Nevertheless, one should remark that the SG frequency of achiral molecules crystallizing in Sohncke SGs (i.e. structure with no resolvable molecules) is remarkably similar to those of chiral molecules (see Table 9). Moreover, it was demonstrated that symmetry dependencies are consistent in structures with chiral and achiral molecules or when Sohncke and non-Sohncke structures are compared.58
| Achiral | Chiral | ||
|---|---|---|---|
| SG no. | SG symbol | Frequency (N) | Frequency (N) |
| 19 | P212121 | 50.2% (8856) | 48.4% (35079) |
| 4 | P21 | 33.3% (5874) | 36.3% (26275) |
| 1 | P1 | 5.7% (1005) | 5.3% (3804) |
| 5 | C2 | 3.6% (640) | 5.4% (3928) |
| 18 | P21212 | 2.4% (417) | 2.0% (1455) |
| 92 | P41212 | 1.6% (282) | 0.6% (447) |
| 96 | P43212 | 1.2% (208) | 0.6% (421) |
| 20 | C2221 | 0.8% (144) | 0.6% (447) |
| 76 | P41 | 0.7% (116) | 0.4% (289) |
| 145 | P32 | 0.5% (87) | 0.4% (304) |
An estimation of the frequency of spontaneous resolution may be obtained by assuming that the distribution of achiral molecules crystallizing in Sohncke SGs is similar to the conglomerate frequency. Among Sohncke structures, 78.5% are chiral, 19.7% are achiral, 0.8% are meso, 0.8% are racemic (KRCs) and 0.3% are diast. Out of the 393012 analyzed structures, ChiPi detects 210721 achiral structures with 18722 crystallizing in Sohncke SGs. Thus, we estimate the probability of spontaneous resolution at circa below 8% (18722/210721). It could represent at most 6000 structures of chiral organic structures. It is worth mentioning that out of the 210721 achiral structures some contain resolvable molecules (atropoisomer) considered as negligible. This rough estimation could also fluctuate because it does not account for molecular symmetry considerations that could force achiral molecules to crystallize in Sohncke SGs (e.g. C2 molecular symmetry). This value is consistent with a recent study of Rekis (single-component crystal structures, 178924 structures) and Fábián et al. (Z′ > 1, representing 174465 organic structures) estimating the frequency of spontaneous resolution to 9.5% and circa 6%, respectively. These values are also consistent with the estimation of Collet et al. that 5–10% of resolvable molecules crystallized as conglomerates.
Conclusions
The low frequency of KRCs and RCs in non-centrosymmetric SGs is once more an indication of the prevalence of inversion centers in the crystal packing of racemic compounds.58,59 The number of non-centrosymmetric racemic compounds is estimated to be 6–6.5% of the organic structures in the CSD. This value seems to be constant over the last 10 years.The number of enantiopure structures in Sohncke SGs is estimated at 78%; the other structures are achiral (20%), meso (1%), KRCs (0.8%), and diast (0.3%). The “unbalanced compounds” (scalemic composition) are rarer than KRCs and represent less than 1/10000th of the entire CSD (37 structures). Of course, this low frequency of scalemic compounds is probably the consequence of the low number of studies for crystallization from scalemic mixtures in enantiomeric systems.
A new list containing 724 structures has been documented and should deserve more attention to establish the authentic KRCs. Out of this list, 159 KRC structures were classified as ‘ambiguous’ because of the PLATON ADDSYM alert (although it could be an indication of the prevalence of pseudo-symmetry in this class of compounds). For 5% (among 565 structures), PLATON detects a non-crystallographic inversion center.
The SG frequency ranking is abnormal in KRCs with the P21 space group over-represented (50% of KRC structures) compared to the normal Sohncke SG ranking (35%). While there are in general 35% more P212121 structures than P21 in the entire CSD, this number drastically falls in KRCs. When Z′ is an even number, the frequencies are completely inverted with 130% more P21 than P212121 structures. The prevalence of P21 space group is not only restricted to KRCs but is valid for even Z′ in Sohncke SGs regardless of whether the molecules are chiral or not. By contrast, the odd Z′ structures follow the same trends as the whole CSD (globally similar to Z′ = 1 structures). 56738 single-component crystals crystallizing in Sohncke SGs for Z′ = 1 to 6 were checked by PLATON in batch mode. The number of alerts and non-crystallographic inversion centers detected in these structures follows the same trends as the ratio of P21/P212121 structures. This relation could be a consequence of missing some symmetry elements in these structures for even Z′ leading to a prevalence of P21 over P212121 structures. However, it is worth mentioning that the omission of the structures having PLATON alerts or non-crystallographic inversion centers does not change the SG frequency among even Z′ structures. A thorough investigation of the crystal structures should be performed, especially to check the presence of pseudo twofold axes or 21 screw axes in order to find an explanation for that abnormal SG ranking.
Circa 20000 molecular overlays have been performed in enantiopure and racemic single-component crystals (for Z′ = 2). The principal conclusion is that the molecules are more different in enantiopure than in racemic structures (i.e. the molecular conformation deviates more for two molecules of the same enantiomers than for a pair of antipodes). In part, this deviation could be explained by the consequence of pseudo-symmetry in the structure.60
KRCs have a greater propensity to exhibit polymorphism (2.8%) compared to the entire CSD but, to date, there is no significant evidence of any relationship with the molecular conformations adopted by molecules in the structure.
The data and information that could be extracted from the CSD need to be refined. For instance, KRCs exhibiting disorder could actually correspond to a slight deviation of the racemic composition and thus these could be solid solutions. Future work will hopefully solve this problem. We hope that ChiPi script could be useful for the community interested in chirality in the solid state and everyone is free to use it.
Conflicts of interest
There are no conflicts of interest to declare.Acknowledgements
This work was funded by the European Regional Development Fund (FEDER) through the DIXOS project.Notes and references
-
J. Jacques, A. Collet and S. H. Wilen, Enantiomers, racemates, and resolutions, 1981 Search PubMed
.
- G. Coquerel, Chem. Soc. Rev., 2014, 43, 2286–2300 RSC
- T. Rekis, A. Bērziņš, L. Orola, T. Holczbauer, A. Actiņš, A. Seidel-Morgenstern and H. Lorenz, Cryst. Growth Des., 2017, 17, 1411–1418 CrossRef CAS
- C. Brandel, S. Petit, Y. Cartigny and G. Coquerel, Curr. Pharm. Des., 2016, 22, 4929–4941 CrossRef CAS PubMed
- T. Rekis, Acta Crystallogr., Sect. B: Struct. Sci., Cryst. Eng. Mater., 2020, 76, 307–315 CrossRef CAS
- I. Bernal and R. A. Lalancette, C. R. Chim., 2015, 18, 929–934 CrossRef CAS
- R. Bishop and M. L. Scudder, Cryst. Growth Des., 2009, 9, 2890–2894 CrossRef CAS
- L. Fábián and C. P. Brock, Acta Crystallogr., Sect. B: Struct. Sci., 2010, 66, 94–103 CrossRef PubMed
- E. Grothe, H. Meekes and R. de Gelder, Acta Crystallogr., Sect. B: Struct. Sci., Cryst. Eng. Mater., 2017, 73, 453–465 CrossRef CAS PubMed
- I. Bernal and S. Watkins, Acta Crystallogr., Sect. C: Struct. Chem., 2015, 71, 216–221 CrossRef CAS PubMed
- B. Dalhus and C. H. Görbitz, Acta Crystallogr., Sect. B: Struct. Sci., 2000, 56, 715–719 CrossRef CAS PubMed
- S. Eppel and J. Bernstein, Acta Crystallogr., Sect. B: Struct. Sci., 2008, 64, 50–56 CrossRef CAS PubMed
- I. J. Bruno, J. C. Cole, P. R. Edgington, M. Kessler, C. F. Macrae, P. McCabe, J. Pearson and R. Taylor, Acta Crystallogr., Sect. B: Struct. Sci., 2002, 58, 389–397 CrossRef PubMed
- D. A. Clemente and A. Marzotto, Acta Crystallogr., Sect. B: Struct. Sci., 2003, 59, 43–50 CrossRef PubMed
- D. A. Clemente, Tetrahedron, 2003, 59, 8445–8455 CrossRef CAS
- D. A. Clemente and A. Marzotto, Acta Crystallogr., Sect. B: Struct. Sci., 2004, 60, 287–292 CrossRef PubMed
- D. A. Clemente, Inorg. Chim. Acta, 2005, 358, 1725–1748 CrossRef CAS
- R. E. Marsh and D. A. Clemente, Inorg. Chim. Acta, 2007, 360, 4017–4024 CrossRef CAS
- R. E. Marsh, V. Schomaker and F. H. Herbstein, Acta Crystallogr., Sect. B: Struct. Sci., 1998, 54, 921–924 CrossRef
- R. E. Marsh and I. Bernal, Acta Crystallogr., Sect. B: Struct. Sci., 1995, 51, 300–307 CrossRef
- R. E. Marsh and F. H. Herbstein, Acta Crystallogr., Sect. B: Struct. Sci., 1988, 44, 77–88 CrossRef PubMed
- F. H. Herbstein and R. E. Marsh, Acta Crystallogr., Sect. B: Struct. Sci., 1998, 54, 677–686 CrossRef
- R. E. Marsh, Acta Crystallogr., Sect. B: Struct. Sci., 1999, 55, 931–936 CrossRef PubMed
- R. E. Marsh, Acta Crystallogr., Sect. B: Struct. Sci., 2000, 56, 744–744 CrossRef
- A. L. Spek, Acta Crystallogr., Sect. D: Biol. Crystallogr., 2009, 65, 148–155 CrossRef CAS PubMed
- C. F. Macrae, I. J. Bruno, J. A. Chisholm, P. R. Edgington, P. McCabe, E. Pidcock, L. Rodriguez-Monge, R. Taylor, J. van de Streek and P. A. Wood, J. Appl. Crystallogr., 2008, 41, 466–470 CrossRef CAS
- E. Pidcock, W. D. S. Motherwell and J. C. Cole, Acta Crystallogr., Sect. B: Struct. Sci., 2003, 59, 634–640 CrossRef PubMed
- J. van de Streek and S. Motherwell, CrystEngComm, 2007, 9, 55–64 RSC
- L. Gyevi-Nagy and G. Tasi, Comput. Phys. Commun., 2017, 215, 156–164 CrossRef CAS
- T. Pilati and A. Forni, J. Appl. Crystallogr., 2000, 33, 417–417 CrossRef CAS
- D. Watkin, J. Appl. Crystallogr., 2008, 41, 491–522 CrossRef CAS
- H. Flack and G. Bernardinelli, Inorg. Chim. Acta, 2006, 359, 383–387 CrossRef CAS
- C. P. Brock, Acta Crystallogr., Sect. B: Struct. Sci., Cryst. Eng. Mater., 2016, 72, 807–821 CrossRef CAS PubMed
- A. D. Bond, CrystEngComm, 2010, 12, 2492–2500 RSC
- R. Taylor, J. C. Cole and C. R. Groom, Cryst. Growth Des., 2016, 16, 2988–3001 CrossRef CAS
- G. R. Desiraju, CrystEngComm, 2007, 9, 91–92 RSC
- K. M. Steed and J. W. Steed, Chem. Rev., 2015, 115, 2895–2933 CrossRef CAS PubMed
- M. Hoquante, M. Sanselme, I. B. Rietveld and G. Coquerel, Cryst. Growth Des., 2019, 19, 7396–7401 CrossRef CAS
- K. Kersten, R. Kaur and A. Matzger, IUCrJ, 2018, 5, 124–129 CrossRef CAS PubMed
- R. Laubenstein, M. D. Şerb, U. Englert, G. Raabe, T. Braun and B. Braun, Chem. Commun., 2016, 52, 1214–1217 RSC
- U. B. R. Khandavilli, M. Lusi, B. R. Bhogala, A. R. Maguire, M. Stein and S. E. Lawrence, Chem. Commun., 2016, 52, 8309–8312 RSC
- N. Tumanova, N. Tumanov, F. Fischer, F. Morelle, V. Ban, K. Robeyns, Y. Filinchuk, J. Wouters, F. Emmerling and T. Leyssens, CrystEngComm, 2018, 20, 7308–7321 RSC
- Y. Schouwstra, Acta Crystallogr., Sect. B: Struct. Crystallogr. Cryst. Chem., 1973, 29, 1636–1641 CrossRef CAS
- A. Hempel, N. Camerman, A. Camerman and D. Mastropaolo, Acta Crystallogr., Sect. E: Struct. Rep. Online, 2005, 61, o1595–o1597 CrossRef CAS
- J. B. van Mechelen, R. Peschar and H. Schenk, Acta Crystallogr., Sect. B: Struct. Sci., 2008, 64, 249–259 CrossRef CAS PubMed
- P. R. Sahoo and S. Kumar, Sens. Actuators, B, 2016, 226, 548–552 CrossRef CAS
- V. Seiler, N. Tumanov, K. Robeyns, J. Wouters, B. Champagne and T. Leyssens, Crystals, 2017, 7, 84 CrossRef
- O. A. Lodochnikova, R. M. Khakimov, L. Z. Latypova, A. R. Kurbangalieva and I. A. Litvinov, Russ. Chem. Bull., 2016, 64, 2444–2453 CrossRef
- W. Wong-Ng, P. T. Cheng and S. C. Nyburg, Acta Crystallogr., Sect. B: Struct. Sci., 1984, 40, 151–158 CrossRef
- A. Turza, A. Pop, M. Muresan-Pop, L. Zarbo and G. Borodi, J. Mol. Struct., 2020, 1199, 126973 CrossRef CAS
- S. Krishnaswamy, R. G. Gonnade, M. M. Bhadbhade and M. S. Shashidhar, Acta Crystallogr., Sect. C: Cryst. Struct. Commun., 2009, 65, o54–o57 CrossRef CAS PubMed
- M. M. H. Smets, M. B. Pitak, J. Cadden, V. R. Kip, G. A. de Wijs, E. R. H. van Eck, P. Tinnemans, H. Meekes, E. Vlieg, S. J. Coles and H. M. Cuppen, Cryst. Growth Des., 2017, 18, 242–252 CrossRef PubMed
- N. Tumanova, V. Seiler, N. Tumanov, K. Robeyns, Y. Filinchuk, J. Wouters and T. Leyssens, Cryst. Growth Des., 2019, 19, 3652–3659 CrossRef CAS
- H. Quast, J. Carlsen, H. Röschert, E. M. Peters, K. Peters and H. G. V. Schnering, Chem. Ber., 1992, 125, 2591–2611 CrossRef CAS
- O. A. Lodochnikova, L. S. Kosolapova, A. F. Saifina, A. T. Gubaidullin, R. R. Fayzullin, A. R. Khamatgalimov, I. A. Litvinov and A. R. Kurbangalieva, CrystEngComm, 2017, 19, 7277–7286 RSC
- D. S. Giera, L. Hennig, T. Gelbrich and C. Schneider, Z. Naturforsch., B: J. Chem. Sci., 2011, 66, 419–424 CAS
- A. T. Gubaidullin, A. I. Samigullina, Z. A. Bredikhina and A. A. Bredikhin, CrystEngComm, 2014, 16, 6716 RSC
- R. Taylor, F. H. Allen and J. C. Cole, CrystEngComm, 2015, 17, 2651–2666 RSC
-
A. Kitaigorodsky, Molecular crystals and molecules, Academic Press, 1973 Search PubMed
- D. Watkin, J. Appl. Crystallogr., 2008, 41, 491–522 CrossRef CAS
Footnotes |
| † Electronic supplementary information (ESI) available: ChiPi Python script, tutorial to use ChiPi, information about ChiPi procedure, lists of KRC refcodes, results file of organic teaching subset. See DOI: 10.1039/d0ce00303d |
| ‡ The ChiPi code will be updated to work with future CCDC releases. The updates will be available here: https://labsms.univ-rouen.fr/en/content/chipi. |
| This journal is © The Royal Society of Chemistry 2020 |